Cajun vs Immigrants from Bosnia and Herzegovina Median Male Earnings
COMPARE
Cajun
Immigrants from Bosnia and Herzegovina
Median Male Earnings
Median Male Earnings Comparison
Cajuns
Immigrants from Bosnia and Herzegovina
$52,325
MEDIAN MALE EARNINGS
10.7/ 100
METRIC RATING
212th/ 347
METRIC RANK
$52,869
MEDIAN MALE EARNINGS
16.9/ 100
METRIC RATING
201st/ 347
METRIC RANK
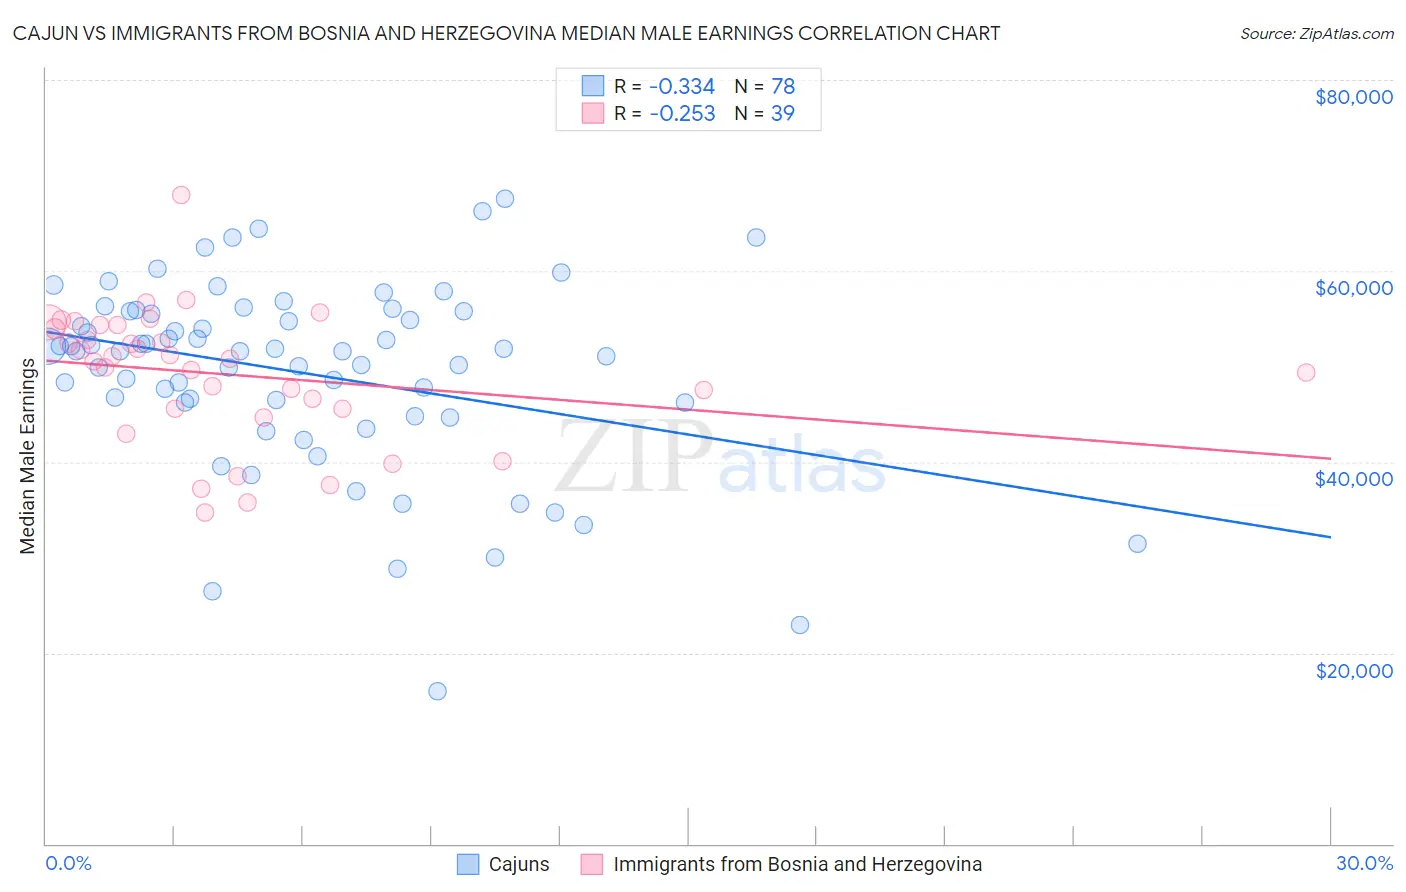
Cajun vs Immigrants from Bosnia and Herzegovina Median Male Earnings Correlation Chart
The statistical analysis conducted on geographies consisting of 149,660,715 people shows a mild negative correlation between the proportion of Cajuns and median male earnings in the United States with a correlation coefficient (R) of -0.334 and weighted average of $52,325. Similarly, the statistical analysis conducted on geographies consisting of 156,811,479 people shows a weak negative correlation between the proportion of Immigrants from Bosnia and Herzegovina and median male earnings in the United States with a correlation coefficient (R) of -0.253 and weighted average of $52,869, a difference of 1.0%.
Median Male Earnings Correlation Summary
| Measurement | Cajun | Immigrants from Bosnia and Herzegovina |
| Minimum | $15,945 | $34,670 |
| Maximum | $67,496 | $67,986 |
| Range | $51,551 | $33,316 |
| Mean | $49,309 | $49,159 |
| Median | $51,622 | $50,833 |
| Interquartile 25% (IQ1) | $46,199 | $45,544 |
| Interquartile 75% (IQ3) | $55,757 | $54,290 |
| Interquartile Range (IQR) | $9,558 | $8,746 |
| Standard Deviation (Sample) | $9,949 | $6,958 |
| Standard Deviation (Population) | $9,885 | $6,868 |
Demographics Similar to Cajuns and Immigrants from Bosnia and Herzegovina by Median Male Earnings
In terms of median male earnings, the demographic groups most similar to Cajuns are Native Hawaiian ($52,306, a difference of 0.040%), Tlingit-Haida ($52,409, a difference of 0.16%), Delaware ($52,412, a difference of 0.17%), Bermudan ($52,465, a difference of 0.27%), and Nonimmigrants ($52,170, a difference of 0.30%). Similarly, the demographic groups most similar to Immigrants from Bosnia and Herzegovina are Immigrants from Uruguay ($52,860, a difference of 0.020%), Panamanian ($52,835, a difference of 0.060%), Immigrants from Thailand ($52,908, a difference of 0.070%), Ghanaian ($52,810, a difference of 0.11%), and Immigrants from Colombia ($52,725, a difference of 0.27%).
| Demographics | Rating | Rank | Median Male Earnings |
| Immigrants | Africa | 26.6 /100 | #196 | Fair $53,457 |
| Immigrants | Kenya | 26.0 /100 | #197 | Fair $53,427 |
| Immigrants | Costa Rica | 22.6 /100 | #198 | Fair $53,237 |
| Tongans | 22.3 /100 | #199 | Fair $53,218 |
| Immigrants | Thailand | 17.5 /100 | #200 | Poor $52,908 |
| Immigrants | Bosnia and Herzegovina | 16.9 /100 | #201 | Poor $52,869 |
| Immigrants | Uruguay | 16.8 /100 | #202 | Poor $52,860 |
| Panamanians | 16.5 /100 | #203 | Poor $52,835 |
| Ghanaians | 16.1 /100 | #204 | Poor $52,810 |
| Immigrants | Colombia | 15.0 /100 | #205 | Poor $52,725 |
| Immigrants | Iraq | 14.5 /100 | #206 | Poor $52,681 |
| Vietnamese | 12.7 /100 | #207 | Poor $52,525 |
| Venezuelans | 12.5 /100 | #208 | Poor $52,510 |
| Bermudans | 12.1 /100 | #209 | Poor $52,465 |
| Delaware | 11.5 /100 | #210 | Poor $52,412 |
| Tlingit-Haida | 11.5 /100 | #211 | Poor $52,409 |
| Cajuns | 10.7 /100 | #212 | Poor $52,325 |
| Native Hawaiians | 10.5 /100 | #213 | Poor $52,306 |
| Immigrants | Nonimmigrants | 9.3 /100 | #214 | Tragic $52,170 |
| Immigrants | Cameroon | 8.9 /100 | #215 | Tragic $52,119 |
| Immigrants | Venezuela | 8.3 /100 | #216 | Tragic $52,041 |