Cajun vs Immigrants from Jordan Householder Income Ages 45 - 64 years

COMPARE

Cajun
Race
Ancestry
AfghanAfricanAlaska NativeAlaskan AthabascanAlbanianAleutAlsatianAmericanApacheArabArapahoArgentineanArmenianAssyrian/Chaldean/SyriacAustralianAustrianBahamianBangladeshiBarbadianBasqueBelgianBelizeanBermudanBhutaneseBlackfeetBolivianBrazilianBritishBritish West IndianBulgarianBurmeseCajunCambodianCanadianCape VerdeanCarpatho RusynCelticCentral AmericanCentral American IndianCherokeeCheyenneChickasawChileanChineseChippewaChoctawColombianColvilleComancheCosta RicanCreeCreekCroatianCrowCubanCypriotCzechCzechoslovakianDanishDelawareDominicanDutchDutch West IndianEastern EuropeanEcuadorianEgyptianEnglishEstonianEthiopianEuropeanFijianFilipinoFinnishFrenchFrench American IndianFrench CanadianGermanGerman RussianGhanaianGreekGuamanian/ChamorroGuatemalanGuyaneseHaitianHmongHonduranHopiHoumaHungarianIcelanderIndian (Asian)IndonesianInupiatIranianIraqiIrishIroquoisIsraeliItalianJamaicanJapaneseJordanianKenyanKiowaKoreanLaotianLatvianLebaneseLiberianLithuanianLumbeeLuxembourgerMacedonianMalaysianMalteseMarshalleseMenomineeMexicanMexican American IndianMongolianMoroccanNative HawaiianNavajoNepaleseNew ZealanderNicaraguanNigerianNorthern EuropeanNorwegianOkinawanOsageOttawaPaiutePakistaniPalestinianPanamanianParaguayanPennsylvania GermanPeruvianPimaPolishPortuguesePotawatomiPuebloPuerto RicanPuget Sound SalishRomanianRussianSalvadoranSamoanScandinavianScotch-IrishScottishSeminoleSenegaleseSerbianShoshoneSierra LeoneanSiouxSlavicSlovakSloveneSomaliSouth AfricanSouth AmericanSouth American IndianSoviet UnionSpaniardSpanishSpanish AmericanSpanish American IndianSri LankanSubsaharan AfricanSudaneseSwedishSwissSyrianTaiwaneseThaiTlingit-HaidaTohono O'OdhamTonganTrinidadian and TobagonianTsimshianTurkishU.S. Virgin IslanderUgandanUkrainianUruguayanUteVenezuelanVietnameseWelshWest IndianYakamaYaquiYugoslavianYumanYup'ikZimbabwean
Immigration
NonimmigrantsImmigrantsAfghanistanAfricaAlbaniaArgentinaArmeniaAsiaAustraliaAustriaBahamasBangladeshBarbadosBelarusBelgiumBelizeBoliviaBosnia and HerzegovinaBrazilBulgariaBurma/MyanmarCabo VerdeCambodiaCameroonCanadaCaribbeanCentral AmericaChileChinaColombiaCongoCosta RicaCroatiaCubaCzechoslovakiaDenmarkDominicaDominican RepublicEastern AfricaEastern AsiaEastern EuropeEcuadorEgyptEl SalvadorEnglandEritreaEthiopiaEuropeFijiFranceGermanyGhanaGreeceGrenadaGuatemalaGuyanaHaitiHondurasHong KongHungaryIndiaIndonesiaIranIraqIrelandIsraelItalyJamaicaJapanKazakhstanKenyaKoreaKuwaitLaosLatin AmericaLatviaLebanonLiberiaLithuaniaMalaysiaMexicoMicronesiaMiddle AfricaMoldovaMoroccoNepalNetherlandsNicaraguaNigeriaNorth AmericaNorth MacedoniaNorthern AfricaNorthern EuropeNorwayOceaniaPakistanPanamaPeruPhilippinesPolandPortugalRomaniaRussiaSaudi ArabiaScotlandSenegalSerbiaSierra LeoneSingaporeSomaliaSouth AfricaSouth AmericaSouth Central AsiaSouth Eastern AsiaSouthern EuropeSpainSri LankaSt. Vincent and the GrenadinesSudanSwedenSwitzerlandSyriaTaiwanThailandTrinidad and TobagoTurkeyUgandaUkraineUruguayUzbekistanVenezuelaVietnamWest IndiesWestern AfricaWestern AsiaWestern EuropeYemenZaireZimbabweAzores
Immigrants from Jordan
Race
Ancestry
AfghanAfricanAlaska NativeAlaskan AthabascanAlbanianAleutAlsatianAmericanApacheArabArapahoArgentineanArmenianAssyrian/Chaldean/SyriacAustralianAustrianBahamianBangladeshiBarbadianBasqueBelgianBelizeanBermudanBhutaneseBlackfeetBolivianBrazilianBritishBritish West IndianBulgarianBurmeseCambodianCanadianCape VerdeanCarpatho RusynCelticCentral AmericanCentral American IndianCherokeeCheyenneChickasawChileanChineseChippewaChoctawColombianColvilleComancheCosta RicanCreeCreekCroatianCrowCubanCypriotCzechCzechoslovakianDanishDelawareDominicanDutchDutch West IndianEastern EuropeanEcuadorianEgyptianEnglishEstonianEthiopianEuropeanFijianFilipinoFinnishFrenchFrench American IndianFrench CanadianGermanGerman RussianGhanaianGreekGuamanian/ChamorroGuatemalanGuyaneseHaitianHmongHonduranHopiHoumaHungarianIcelanderIndian (Asian)IndonesianInupiatIranianIraqiIrishIroquoisIsraeliItalianJamaicanJapaneseJordanianKenyanKiowaKoreanLaotianLatvianLebaneseLiberianLithuanianLumbeeLuxembourgerMacedonianMalaysianMalteseMarshalleseMenomineeMexicanMexican American IndianMongolianMoroccanNative HawaiianNavajoNepaleseNew ZealanderNicaraguanNigerianNorthern EuropeanNorwegianOkinawanOsageOttawaPaiutePakistaniPalestinianPanamanianParaguayanPennsylvania GermanPeruvianPimaPolishPortuguesePotawatomiPuebloPuerto RicanPuget Sound SalishRomanianRussianSalvadoranSamoanScandinavianScotch-IrishScottishSeminoleSenegaleseSerbianShoshoneSierra LeoneanSiouxSlavicSlovakSloveneSomaliSouth AfricanSouth AmericanSouth American IndianSoviet UnionSpaniardSpanishSpanish AmericanSpanish American IndianSri LankanSubsaharan AfricanSudaneseSwedishSwissSyrianTaiwaneseThaiTlingit-HaidaTohono O'OdhamTonganTrinidadian and TobagonianTsimshianTurkishU.S. Virgin IslanderUgandanUkrainianUruguayanUteVenezuelanVietnameseWelshWest IndianYakamaYaquiYugoslavianYumanYup'ikZimbabwean
Immigration
NonimmigrantsImmigrantsAfghanistanAfricaAlbaniaArgentinaArmeniaAsiaAustraliaAustriaBahamasBangladeshBarbadosBelarusBelgiumBelizeBoliviaBosnia and HerzegovinaBrazilBulgariaBurma/MyanmarCabo VerdeCambodiaCameroonCanadaCaribbeanCentral AmericaChileChinaColombiaCongoCosta RicaCroatiaCubaCzechoslovakiaDenmarkDominicaDominican RepublicEastern AfricaEastern AsiaEastern EuropeEcuadorEgyptEl SalvadorEnglandEritreaEthiopiaEuropeFijiFranceGermanyGhanaGreeceGrenadaGuatemalaGuyanaHaitiHondurasHong KongHungaryIndiaIndonesiaIranIraqIrelandIsraelItalyJamaicaJapanJordanKazakhstanKenyaKoreaKuwaitLaosLatin AmericaLatviaLebanonLiberiaLithuaniaMalaysiaMexicoMicronesiaMiddle AfricaMoldovaMoroccoNepalNetherlandsNicaraguaNigeriaNorth AmericaNorth MacedoniaNorthern AfricaNorthern EuropeNorwayOceaniaPakistanPanamaPeruPhilippinesPolandPortugalRomaniaRussiaSaudi ArabiaScotlandSenegalSerbiaSierra LeoneSingaporeSomaliaSouth AfricaSouth AmericaSouth Central AsiaSouth Eastern AsiaSouthern EuropeSpainSri LankaSt. Vincent and the GrenadinesSudanSwedenSwitzerlandSyriaTaiwanThailandTrinidad and TobagoTurkeyUgandaUkraineUruguayUzbekistanVenezuelaVietnamWest IndiesWestern AfricaWestern AsiaWestern EuropeYemenZaireZimbabweAzores
Householder Income Ages 45 - 64 years
Income
Poverty
Unemployment
Labor Participation
Family Structure
Vehicle Availability
Education Level
Disability

Householder Income Ages 45 - 64 years Comparison

Cajuns

Immigrants from Jordan

Tragic
Exceptional
$83,015
HOUSEHOLDER INCOME AGES 45 - 64 YEARS
0.0/ 100
METRIC RATING
312th/ 347
METRIC RANK
$106,164
HOUSEHOLDER INCOME AGES 45 - 64 YEARS
94.9/ 100
METRIC RATING
119th/ 347
METRIC RANK

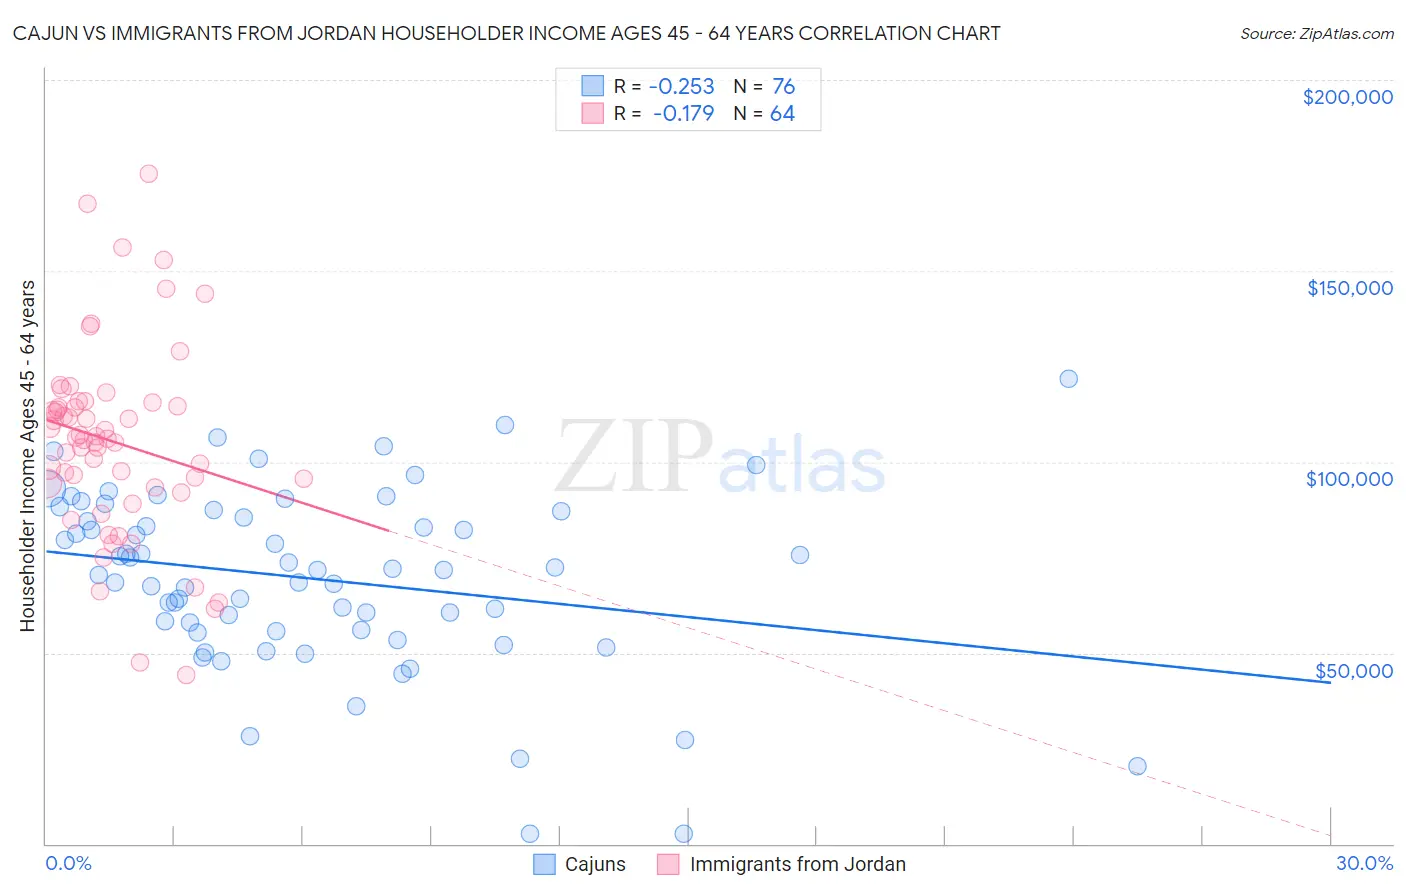
Cajun vs Immigrants from Jordan Householder Income Ages 45 - 64 years Correlation Chart

The statistical analysis conducted on geographies consisting of 149,484,313 people shows a weak negative correlation between the proportion of Cajuns and household income with householder between the ages 45 and 64 in the United States with a correlation coefficient (R) of -0.253 and weighted average of $83,015. Similarly, the statistical analysis conducted on geographies consisting of 181,177,214 people shows a poor negative correlation between the proportion of Immigrants from Jordan and household income with householder between the ages 45 and 64 in the United States with a correlation coefficient (R) of -0.179 and weighted average of $106,164, a difference of 27.9%.
Cajun vs Immigrants from Jordan Householder Income Ages 45 - 64 years

Householder Income Ages 45 - 64 years Correlation Summary

MeasurementCajunImmigrants from Jordan
Minimum$2,499$44,265
Maximum$121,893$175,361
Range$119,394$131,096
Mean$69,425$105,324
Median$71,604$106,275
Interquartile 25% (IQ1)$55,904$93,850
Interquartile 75% (IQ3)$86,282$114,914
Interquartile Range (IQR)$30,378$21,064
Standard Deviation (Sample)$23,334$25,270
Standard Deviation (Population)$23,180$25,072

Similar Demographics by Householder Income Ages 45 - 64 years

Demographics Similar to Cajuns by Householder Income Ages 45 - 64 years

In terms of householder income ages 45 - 64 years, the demographic groups most similar to Cajuns are Immigrants from Bahamas ($83,177, a difference of 0.20%), Immigrants from Haiti ($83,257, a difference of 0.29%), U.S. Virgin Islander ($82,736, a difference of 0.34%), Immigrants from Dominica ($83,311, a difference of 0.36%), and Immigrants from Honduras ($82,697, a difference of 0.39%).
DemographicsRating | RankHouseholder Income Ages 45 - 64 years
Chippewa
0.0
/100
|
#305
Tragic
$83,943
Ute
0.0
/100
|
#306
Tragic
$83,937
Shoshone
0.0
/100
|
#307
Tragic
$83,588
Immigrants | Cabo Verde
0.0
/100
|
#308
Tragic
$83,542
Immigrants | Dominica
0.0
/100
|
#309
Tragic
$83,311
Immigrants | Haiti
0.0
/100
|
#310
Tragic
$83,257
Immigrants | Bahamas
0.0
/100
|
#311
Tragic
$83,177
Cajuns
0.0
/100
|
#312
Tragic
$83,015
U.S. Virgin Islanders
0.0
/100
|
#313
Tragic
$82,736
Immigrants | Honduras
0.0
/100
|
#314
Tragic
$82,697
Paiute
0.0
/100
|
#315
Tragic
$82,629
Immigrants | Caribbean
0.0
/100
|
#316
Tragic
$82,513
Colville
0.0
/100
|
#317
Tragic
$82,474
Choctaw
0.0
/100
|
#318
Tragic
$82,287
Chickasaw
0.0
/100
|
#319
Tragic
$82,193

Demographics Similar to Immigrants from Jordan by Householder Income Ages 45 - 64 years

In terms of householder income ages 45 - 64 years, the demographic groups most similar to Immigrants from Jordan are Immigrants from Western Asia ($106,217, a difference of 0.050%), Immigrants from South Eastern Asia ($106,109, a difference of 0.050%), Albanian ($106,243, a difference of 0.070%), British ($106,264, a difference of 0.090%), and Immigrants from Kuwait ($106,285, a difference of 0.11%).
DemographicsRating | RankHouseholder Income Ages 45 - 64 years
Swedes
95.4
/100
|
#112
Exceptional
$106,377
Europeans
95.4
/100
|
#113
Exceptional
$106,367
Immigrants | Poland
95.3
/100
|
#114
Exceptional
$106,319
Immigrants | Kuwait
95.2
/100
|
#115
Exceptional
$106,285
British
95.2
/100
|
#116
Exceptional
$106,264
Albanians
95.1
/100
|
#117
Exceptional
$106,243
Immigrants | Western Asia
95.0
/100
|
#118
Exceptional
$106,217
Immigrants | Jordan
94.9
/100
|
#119
Exceptional
$106,164
Immigrants | South Eastern Asia
94.8
/100
|
#120
Exceptional
$106,109
Poles
94.4
/100
|
#121
Exceptional
$105,952
Immigrants | North Macedonia
94.2
/100
|
#122
Exceptional
$105,892
Danes
93.4
/100
|
#123
Exceptional
$105,619
Immigrants | Northern Africa
92.8
/100
|
#124
Exceptional
$105,430
Pakistanis
92.4
/100
|
#125
Exceptional
$105,317
Portuguese
92.4
/100
|
#126
Exceptional
$105,309