Cajun vs Icelander Householder Income Ages 45 - 64 years
COMPARE
Cajun
Icelander
Householder Income Ages 45 - 64 years
Householder Income Ages 45 - 64 years Comparison
Cajuns
Icelanders
$83,015
HOUSEHOLDER INCOME AGES 45 - 64 YEARS
0.0/ 100
METRIC RATING
312th/ 347
METRIC RANK
$102,261
HOUSEHOLDER INCOME AGES 45 - 64 YEARS
72.5/ 100
METRIC RATING
160th/ 347
METRIC RANK
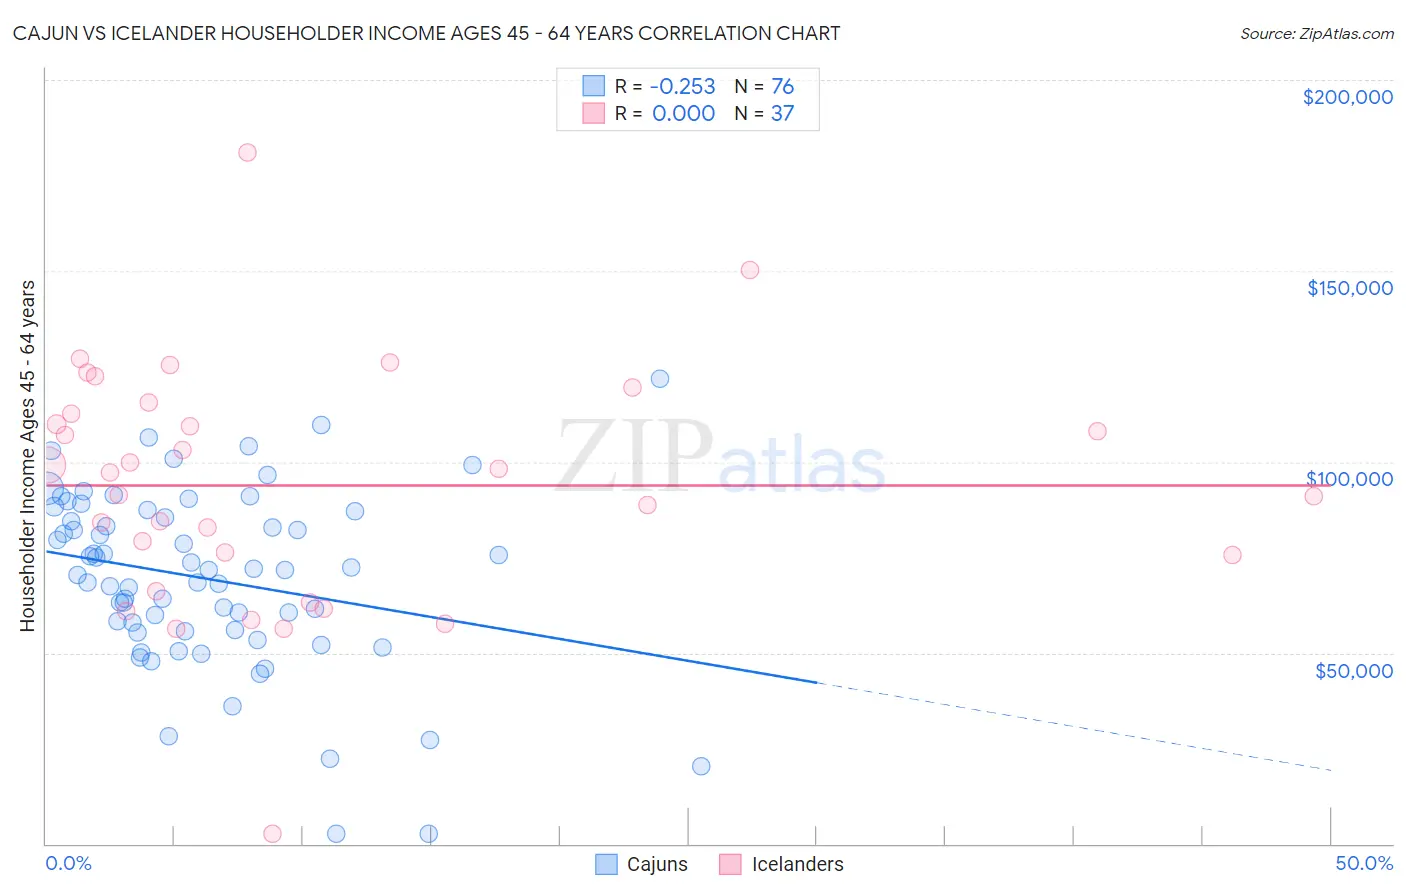
Cajun vs Icelander Householder Income Ages 45 - 64 years Correlation Chart
The statistical analysis conducted on geographies consisting of 149,484,313 people shows a weak negative correlation between the proportion of Cajuns and household income with householder between the ages 45 and 64 in the United States with a correlation coefficient (R) of -0.253 and weighted average of $83,015. Similarly, the statistical analysis conducted on geographies consisting of 159,562,808 people shows no correlation between the proportion of Icelanders and household income with householder between the ages 45 and 64 in the United States with a correlation coefficient (R) of 0.000 and weighted average of $102,261, a difference of 23.2%.
Householder Income Ages 45 - 64 years Correlation Summary
| Measurement | Cajun | Icelander |
| Minimum | $2,499 | $2,499 |
| Maximum | $121,893 | $180,868 |
| Range | $119,394 | $178,369 |
| Mean | $69,425 | $93,816 |
| Median | $71,604 | $97,265 |
| Interquartile 25% (IQ1) | $55,904 | $70,912 |
| Interquartile 75% (IQ3) | $86,282 | $114,136 |
| Interquartile Range (IQR) | $30,378 | $43,224 |
| Standard Deviation (Sample) | $23,334 | $32,005 |
| Standard Deviation (Population) | $23,180 | $31,569 |
Similar Demographics by Householder Income Ages 45 - 64 years
Demographics Similar to Cajuns by Householder Income Ages 45 - 64 years
In terms of householder income ages 45 - 64 years, the demographic groups most similar to Cajuns are Immigrants from Bahamas ($83,177, a difference of 0.20%), Immigrants from Haiti ($83,257, a difference of 0.29%), U.S. Virgin Islander ($82,736, a difference of 0.34%), Immigrants from Dominica ($83,311, a difference of 0.36%), and Immigrants from Honduras ($82,697, a difference of 0.39%).
| Demographics | Rating | Rank | Householder Income Ages 45 - 64 years |
| Chippewa | 0.0 /100 | #305 | Tragic $83,943 |
| Ute | 0.0 /100 | #306 | Tragic $83,937 |
| Shoshone | 0.0 /100 | #307 | Tragic $83,588 |
| Immigrants | Cabo Verde | 0.0 /100 | #308 | Tragic $83,542 |
| Immigrants | Dominica | 0.0 /100 | #309 | Tragic $83,311 |
| Immigrants | Haiti | 0.0 /100 | #310 | Tragic $83,257 |
| Immigrants | Bahamas | 0.0 /100 | #311 | Tragic $83,177 |
| Cajuns | 0.0 /100 | #312 | Tragic $83,015 |
| U.S. Virgin Islanders | 0.0 /100 | #313 | Tragic $82,736 |
| Immigrants | Honduras | 0.0 /100 | #314 | Tragic $82,697 |
| Paiute | 0.0 /100 | #315 | Tragic $82,629 |
| Immigrants | Caribbean | 0.0 /100 | #316 | Tragic $82,513 |
| Colville | 0.0 /100 | #317 | Tragic $82,474 |
| Choctaw | 0.0 /100 | #318 | Tragic $82,287 |
| Chickasaw | 0.0 /100 | #319 | Tragic $82,193 |
Demographics Similar to Icelanders by Householder Income Ages 45 - 64 years
In terms of householder income ages 45 - 64 years, the demographic groups most similar to Icelanders are Immigrants from Nepal ($102,190, a difference of 0.070%), Scottish ($102,123, a difference of 0.14%), Sierra Leonean ($102,427, a difference of 0.16%), English ($102,021, a difference of 0.24%), and Immigrants from Morocco ($102,015, a difference of 0.24%).
| Demographics | Rating | Rank | Householder Income Ages 45 - 64 years |
| Scandinavians | 79.0 /100 | #153 | Good $102,969 |
| Slovenes | 78.3 /100 | #154 | Good $102,885 |
| Costa Ricans | 77.4 /100 | #155 | Good $102,779 |
| Carpatho Rusyns | 77.4 /100 | #156 | Good $102,777 |
| Immigrants | Ethiopia | 77.3 /100 | #157 | Good $102,763 |
| Slavs | 76.1 /100 | #158 | Good $102,629 |
| Sierra Leoneans | 74.2 /100 | #159 | Good $102,427 |
| Icelanders | 72.5 /100 | #160 | Good $102,261 |
| Immigrants | Nepal | 71.8 /100 | #161 | Good $102,190 |
| Scottish | 71.1 /100 | #162 | Good $102,123 |
| English | 70.1 /100 | #163 | Good $102,021 |
| Immigrants | Morocco | 70.0 /100 | #164 | Good $102,015 |
| Immigrants | Albania | 69.4 /100 | #165 | Good $101,957 |
| Samoans | 65.3 /100 | #166 | Good $101,580 |
| Czechoslovakians | 63.0 /100 | #167 | Good $101,387 |