Cajun vs Immigrants from Middle Africa Householder Income Ages 45 - 64 years
COMPARE
Cajun
Immigrants from Middle Africa
Householder Income Ages 45 - 64 years
Householder Income Ages 45 - 64 years Comparison
Cajuns
Immigrants from Middle Africa
$83,015
HOUSEHOLDER INCOME AGES 45 - 64 YEARS
0.0/ 100
METRIC RATING
312th/ 347
METRIC RANK
$91,293
HOUSEHOLDER INCOME AGES 45 - 64 YEARS
1.1/ 100
METRIC RATING
244th/ 347
METRIC RANK
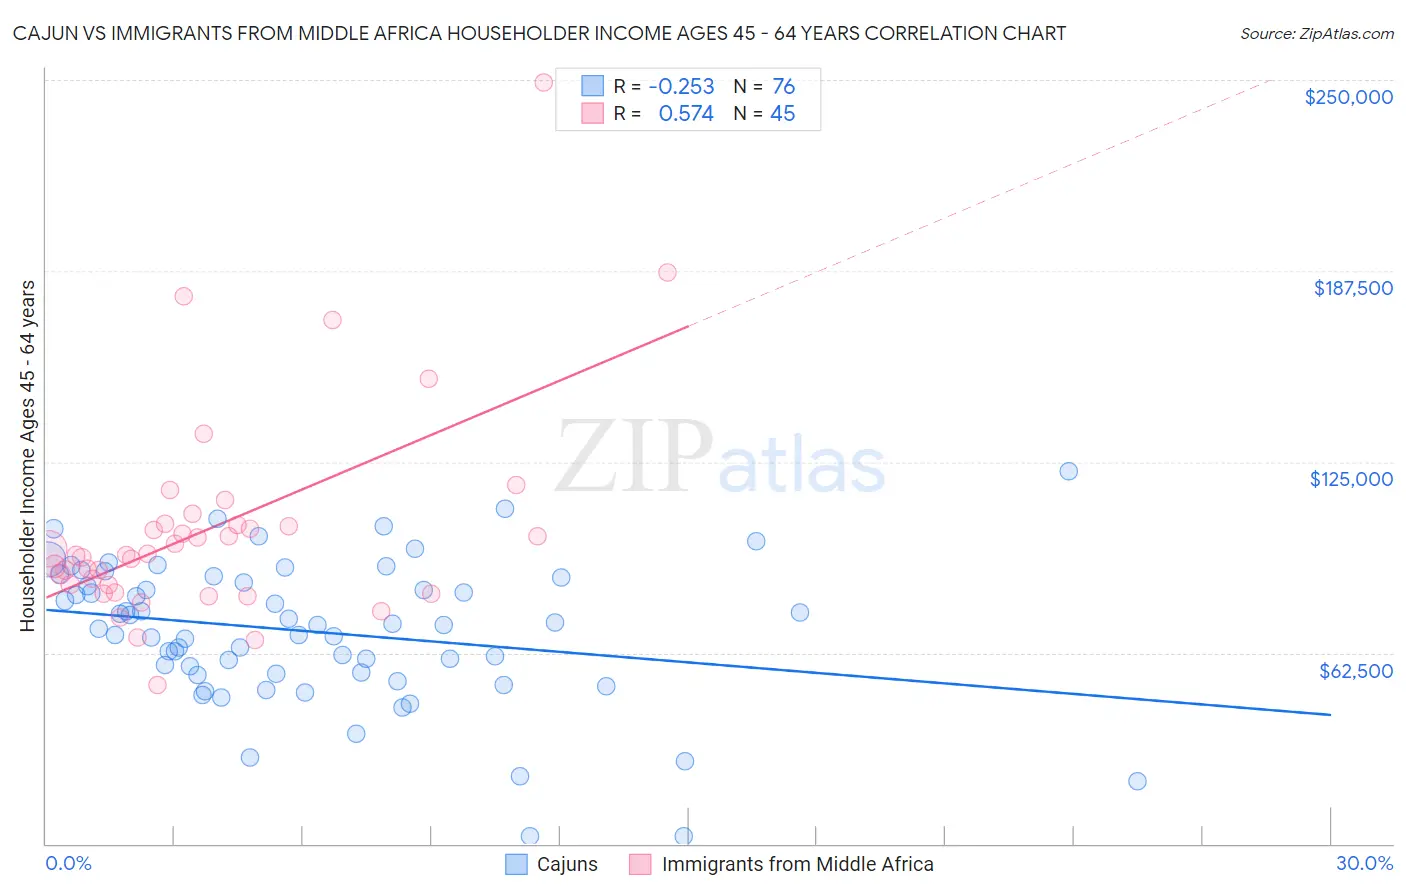
Cajun vs Immigrants from Middle Africa Householder Income Ages 45 - 64 years Correlation Chart
The statistical analysis conducted on geographies consisting of 149,484,313 people shows a weak negative correlation between the proportion of Cajuns and household income with householder between the ages 45 and 64 in the United States with a correlation coefficient (R) of -0.253 and weighted average of $83,015. Similarly, the statistical analysis conducted on geographies consisting of 202,576,362 people shows a substantial positive correlation between the proportion of Immigrants from Middle Africa and household income with householder between the ages 45 and 64 in the United States with a correlation coefficient (R) of 0.574 and weighted average of $91,293, a difference of 10.0%.
Householder Income Ages 45 - 64 years Correlation Summary
| Measurement | Cajun | Immigrants from Middle Africa |
| Minimum | $2,499 | $51,937 |
| Maximum | $121,893 | $249,250 |
| Range | $119,394 | $197,313 |
| Mean | $69,425 | $103,154 |
| Median | $71,604 | $94,432 |
| Interquartile 25% (IQ1) | $55,904 | $83,489 |
| Interquartile 75% (IQ3) | $86,282 | $104,529 |
| Interquartile Range (IQR) | $30,378 | $21,040 |
| Standard Deviation (Sample) | $23,334 | $35,287 |
| Standard Deviation (Population) | $23,180 | $34,892 |
Similar Demographics by Householder Income Ages 45 - 64 years
Demographics Similar to Cajuns by Householder Income Ages 45 - 64 years
In terms of householder income ages 45 - 64 years, the demographic groups most similar to Cajuns are Immigrants from Bahamas ($83,177, a difference of 0.20%), Immigrants from Haiti ($83,257, a difference of 0.29%), U.S. Virgin Islander ($82,736, a difference of 0.34%), Immigrants from Dominica ($83,311, a difference of 0.36%), and Immigrants from Honduras ($82,697, a difference of 0.39%).
| Demographics | Rating | Rank | Householder Income Ages 45 - 64 years |
| Chippewa | 0.0 /100 | #305 | Tragic $83,943 |
| Ute | 0.0 /100 | #306 | Tragic $83,937 |
| Shoshone | 0.0 /100 | #307 | Tragic $83,588 |
| Immigrants | Cabo Verde | 0.0 /100 | #308 | Tragic $83,542 |
| Immigrants | Dominica | 0.0 /100 | #309 | Tragic $83,311 |
| Immigrants | Haiti | 0.0 /100 | #310 | Tragic $83,257 |
| Immigrants | Bahamas | 0.0 /100 | #311 | Tragic $83,177 |
| Cajuns | 0.0 /100 | #312 | Tragic $83,015 |
| U.S. Virgin Islanders | 0.0 /100 | #313 | Tragic $82,736 |
| Immigrants | Honduras | 0.0 /100 | #314 | Tragic $82,697 |
| Paiute | 0.0 /100 | #315 | Tragic $82,629 |
| Immigrants | Caribbean | 0.0 /100 | #316 | Tragic $82,513 |
| Colville | 0.0 /100 | #317 | Tragic $82,474 |
| Choctaw | 0.0 /100 | #318 | Tragic $82,287 |
| Chickasaw | 0.0 /100 | #319 | Tragic $82,193 |
Demographics Similar to Immigrants from Middle Africa by Householder Income Ages 45 - 64 years
In terms of householder income ages 45 - 64 years, the demographic groups most similar to Immigrants from Middle Africa are Immigrants from Trinidad and Tobago ($91,347, a difference of 0.060%), Trinidadian and Tobagonian ($91,357, a difference of 0.070%), Inupiat ($91,355, a difference of 0.070%), Immigrants from Burma/Myanmar ($91,385, a difference of 0.10%), and Immigrants from Ecuador ($91,462, a difference of 0.19%).
| Demographics | Rating | Rank | Householder Income Ages 45 - 64 years |
| Immigrants | Bangladesh | 1.7 /100 | #237 | Tragic $92,208 |
| Pennsylvania Germans | 1.5 /100 | #238 | Tragic $91,956 |
| Immigrants | Ecuador | 1.2 /100 | #239 | Tragic $91,462 |
| Immigrants | Burma/Myanmar | 1.1 /100 | #240 | Tragic $91,385 |
| Trinidadians and Tobagonians | 1.1 /100 | #241 | Tragic $91,357 |
| Inupiat | 1.1 /100 | #242 | Tragic $91,355 |
| Immigrants | Trinidad and Tobago | 1.1 /100 | #243 | Tragic $91,347 |
| Immigrants | Middle Africa | 1.1 /100 | #244 | Tragic $91,293 |
| Guyanese | 0.9 /100 | #245 | Tragic $90,966 |
| Central Americans | 0.9 /100 | #246 | Tragic $90,951 |
| Alaskan Athabascans | 0.9 /100 | #247 | Tragic $90,951 |
| Immigrants | Laos | 0.9 /100 | #248 | Tragic $90,909 |
| Mexican American Indians | 0.8 /100 | #249 | Tragic $90,811 |
| Sub-Saharan Africans | 0.8 /100 | #250 | Tragic $90,691 |
| Americans | 0.7 /100 | #251 | Tragic $90,536 |