Bulgarian vs Indian (Asian) Median Male Earnings
COMPARE
Bulgarian
Indian (Asian)
Median Male Earnings
Median Male Earnings Comparison
Bulgarians
Indians (Asian)
$62,378
MEDIAN MALE EARNINGS
100.0/ 100
METRIC RATING
45th/ 347
METRIC RANK
$66,078
MEDIAN MALE EARNINGS
100.0/ 100
METRIC RATING
18th/ 347
METRIC RANK
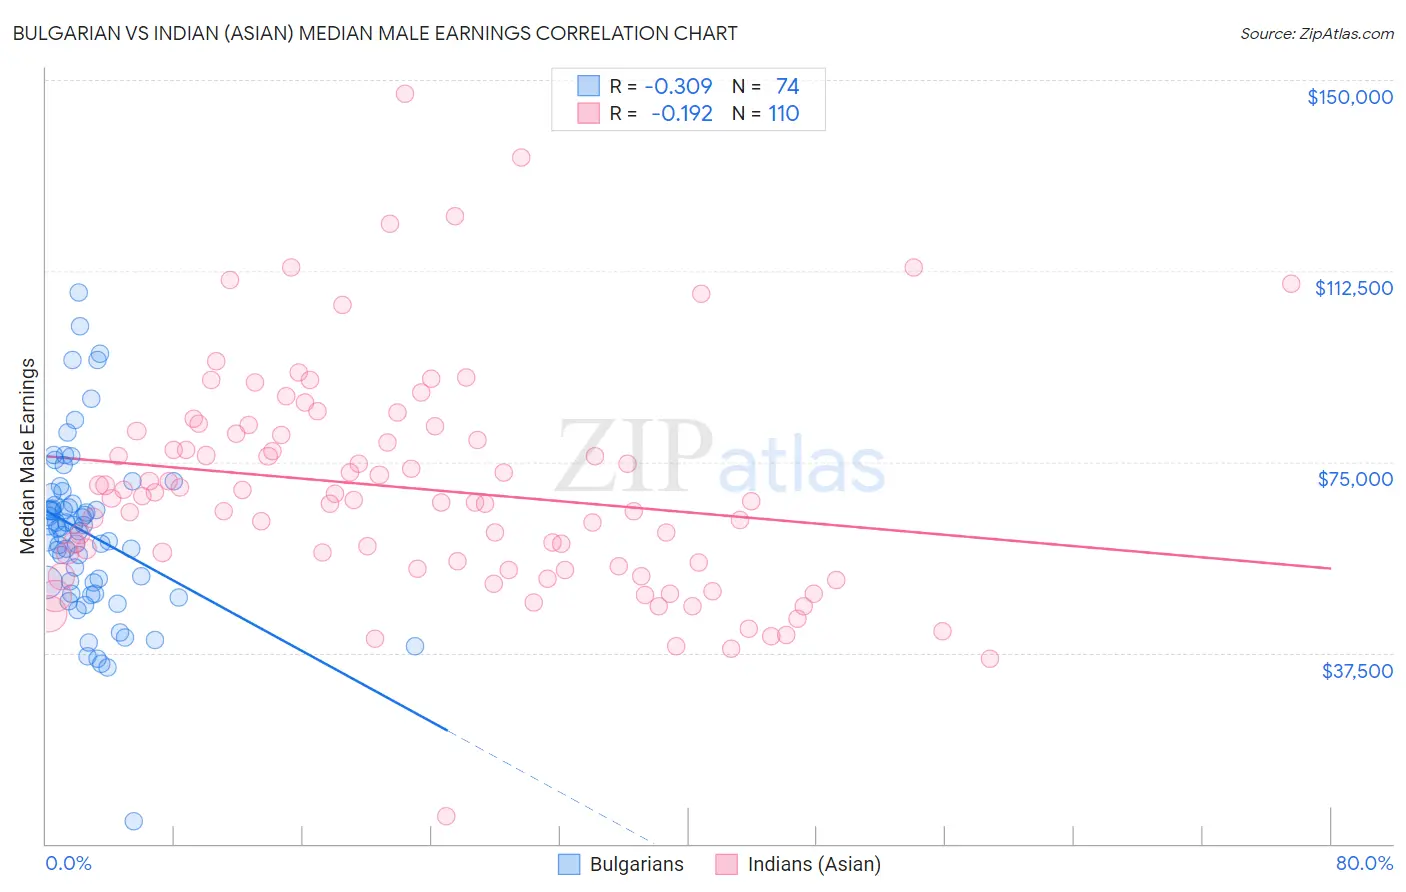
Bulgarian vs Indian (Asian) Median Male Earnings Correlation Chart
The statistical analysis conducted on geographies consisting of 205,598,511 people shows a mild negative correlation between the proportion of Bulgarians and median male earnings in the United States with a correlation coefficient (R) of -0.309 and weighted average of $62,378. Similarly, the statistical analysis conducted on geographies consisting of 494,843,397 people shows a poor negative correlation between the proportion of Indians (Asian) and median male earnings in the United States with a correlation coefficient (R) of -0.192 and weighted average of $66,078, a difference of 5.9%.
Median Male Earnings Correlation Summary
| Measurement | Bulgarian | Indian (Asian) |
| Minimum | $4,447 | $5,439 |
| Maximum | $108,199 | $147,267 |
| Range | $103,752 | $141,828 |
| Mean | $60,992 | $69,730 |
| Median | $62,011 | $67,689 |
| Interquartile 25% (IQ1) | $51,254 | $53,972 |
| Interquartile 75% (IQ3) | $66,727 | $80,584 |
| Interquartile Range (IQR) | $15,473 | $26,612 |
| Standard Deviation (Sample) | $16,836 | $22,146 |
| Standard Deviation (Population) | $16,722 | $22,045 |
Similar Demographics by Median Male Earnings
Demographics Similar to Bulgarians by Median Male Earnings
In terms of median male earnings, the demographic groups most similar to Bulgarians are Cambodian ($62,516, a difference of 0.22%), Immigrants from Czechoslovakia ($62,217, a difference of 0.26%), Immigrants from Austria ($62,164, a difference of 0.35%), Immigrants from Malaysia ($62,121, a difference of 0.41%), and Immigrants from Belarus ($62,658, a difference of 0.45%).
| Demographics | Rating | Rank | Median Male Earnings |
| Maltese | 100.0 /100 | #38 | Exceptional $62,953 |
| Immigrants | South Africa | 100.0 /100 | #39 | Exceptional $62,899 |
| Australians | 100.0 /100 | #40 | Exceptional $62,857 |
| Immigrants | Turkey | 100.0 /100 | #41 | Exceptional $62,728 |
| Immigrants | Greece | 100.0 /100 | #42 | Exceptional $62,689 |
| Immigrants | Belarus | 100.0 /100 | #43 | Exceptional $62,658 |
| Cambodians | 100.0 /100 | #44 | Exceptional $62,516 |
| Bulgarians | 100.0 /100 | #45 | Exceptional $62,378 |
| Immigrants | Czechoslovakia | 99.9 /100 | #46 | Exceptional $62,217 |
| Immigrants | Austria | 99.9 /100 | #47 | Exceptional $62,164 |
| Immigrants | Malaysia | 99.9 /100 | #48 | Exceptional $62,121 |
| Immigrants | Europe | 99.9 /100 | #49 | Exceptional $62,057 |
| Bhutanese | 99.9 /100 | #50 | Exceptional $61,759 |
| Estonians | 99.9 /100 | #51 | Exceptional $61,710 |
| Immigrants | Norway | 99.9 /100 | #52 | Exceptional $61,628 |
Demographics Similar to Indians (Asian) by Median Male Earnings
In terms of median male earnings, the demographic groups most similar to Indians (Asian) are Immigrants from Belgium ($66,125, a difference of 0.070%), Eastern European ($66,472, a difference of 0.60%), Cypriot ($65,549, a difference of 0.81%), Immigrants from Japan ($65,518, a difference of 0.85%), and Immigrants from Sweden ($65,406, a difference of 1.0%).
| Demographics | Rating | Rank | Median Male Earnings |
| Immigrants | Ireland | 100.0 /100 | #11 | Exceptional $67,698 |
| Immigrants | Australia | 100.0 /100 | #12 | Exceptional $67,634 |
| Immigrants | China | 100.0 /100 | #13 | Exceptional $67,353 |
| Okinawans | 100.0 /100 | #14 | Exceptional $67,232 |
| Immigrants | Eastern Asia | 100.0 /100 | #15 | Exceptional $66,903 |
| Eastern Europeans | 100.0 /100 | #16 | Exceptional $66,472 |
| Immigrants | Belgium | 100.0 /100 | #17 | Exceptional $66,125 |
| Indians (Asian) | 100.0 /100 | #18 | Exceptional $66,078 |
| Cypriots | 100.0 /100 | #19 | Exceptional $65,549 |
| Immigrants | Japan | 100.0 /100 | #20 | Exceptional $65,518 |
| Immigrants | Sweden | 100.0 /100 | #21 | Exceptional $65,406 |
| Burmese | 100.0 /100 | #22 | Exceptional $65,236 |
| Immigrants | Korea | 100.0 /100 | #23 | Exceptional $65,079 |
| Immigrants | Northern Europe | 100.0 /100 | #24 | Exceptional $64,987 |
| Immigrants | Denmark | 100.0 /100 | #25 | Exceptional $64,625 |