Bulgarian vs Indian (Asian) Median Household Income
COMPARE
Bulgarian
Indian (Asian)
Median Household Income
Median Household Income Comparison
Bulgarians
Indians (Asian)
$96,290
MEDIAN HOUSEHOLD INCOME
99.9/ 100
METRIC RATING
50th/ 347
METRIC RANK
$105,262
MEDIAN HOUSEHOLD INCOME
100.0/ 100
METRIC RATING
12th/ 347
METRIC RANK
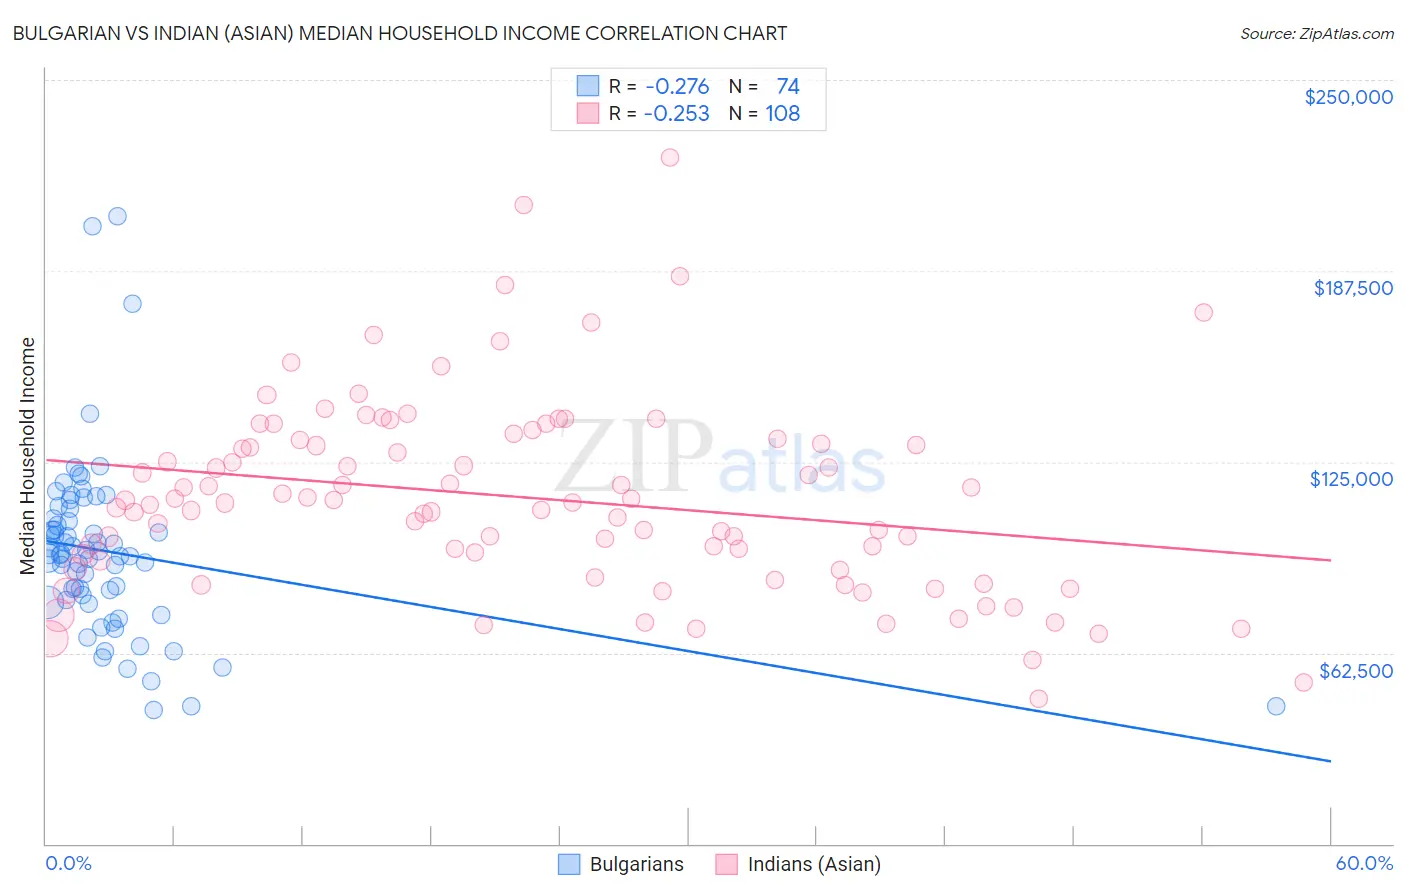
Bulgarian vs Indian (Asian) Median Household Income Correlation Chart
The statistical analysis conducted on geographies consisting of 205,543,372 people shows a weak negative correlation between the proportion of Bulgarians and median household income in the United States with a correlation coefficient (R) of -0.276 and weighted average of $96,290. Similarly, the statistical analysis conducted on geographies consisting of 494,532,621 people shows a weak negative correlation between the proportion of Indians (Asian) and median household income in the United States with a correlation coefficient (R) of -0.253 and weighted average of $105,262, a difference of 9.3%.
Median Household Income Correlation Summary
| Measurement | Bulgarian | Indian (Asian) |
| Minimum | $43,716 | $47,386 |
| Maximum | $205,412 | $224,427 |
| Range | $161,696 | $177,041 |
| Mean | $95,604 | $113,272 |
| Median | $94,643 | $111,615 |
| Interquartile 25% (IQ1) | $79,613 | $91,317 |
| Interquartile 75% (IQ3) | $106,436 | $131,580 |
| Interquartile Range (IQR) | $26,823 | $40,263 |
| Standard Deviation (Sample) | $28,917 | $31,514 |
| Standard Deviation (Population) | $28,721 | $31,368 |
Similar Demographics by Median Household Income
Demographics Similar to Bulgarians by Median Household Income
In terms of median household income, the demographic groups most similar to Bulgarians are Immigrants from Malaysia ($96,292, a difference of 0.0%), Cambodian ($96,324, a difference of 0.040%), Immigrants from Russia ($96,378, a difference of 0.090%), Australian ($96,490, a difference of 0.21%), and Israeli ($96,552, a difference of 0.27%).
| Demographics | Rating | Rank | Median Household Income |
| Immigrants | France | 99.9 /100 | #43 | Exceptional $96,743 |
| Immigrants | Greece | 99.9 /100 | #44 | Exceptional $96,675 |
| Israelis | 99.9 /100 | #45 | Exceptional $96,552 |
| Australians | 99.9 /100 | #46 | Exceptional $96,490 |
| Immigrants | Russia | 99.9 /100 | #47 | Exceptional $96,378 |
| Cambodians | 99.9 /100 | #48 | Exceptional $96,324 |
| Immigrants | Malaysia | 99.9 /100 | #49 | Exceptional $96,292 |
| Bulgarians | 99.9 /100 | #50 | Exceptional $96,290 |
| Estonians | 99.9 /100 | #51 | Exceptional $95,930 |
| Immigrants | South Africa | 99.9 /100 | #52 | Exceptional $95,800 |
| Paraguayans | 99.9 /100 | #53 | Exceptional $95,737 |
| Egyptians | 99.9 /100 | #54 | Exceptional $95,673 |
| Immigrants | Czechoslovakia | 99.9 /100 | #55 | Exceptional $95,319 |
| Immigrants | Austria | 99.9 /100 | #56 | Exceptional $95,277 |
| New Zealanders | 99.8 /100 | #57 | Exceptional $95,146 |
Demographics Similar to Indians (Asian) by Median Household Income
In terms of median household income, the demographic groups most similar to Indians (Asian) are Immigrants from China ($105,335, a difference of 0.070%), Immigrants from Eastern Asia ($104,796, a difference of 0.45%), Immigrants from Ireland ($104,692, a difference of 0.54%), Immigrants from South Central Asia ($106,057, a difference of 0.76%), and Immigrants from Israel ($104,090, a difference of 1.1%).
| Demographics | Rating | Rank | Median Household Income |
| Thais | 100.0 /100 | #5 | Exceptional $110,648 |
| Immigrants | Singapore | 100.0 /100 | #6 | Exceptional $110,428 |
| Iranians | 100.0 /100 | #7 | Exceptional $109,835 |
| Immigrants | Iran | 100.0 /100 | #8 | Exceptional $108,055 |
| Okinawans | 100.0 /100 | #9 | Exceptional $106,624 |
| Immigrants | South Central Asia | 100.0 /100 | #10 | Exceptional $106,057 |
| Immigrants | China | 100.0 /100 | #11 | Exceptional $105,335 |
| Indians (Asian) | 100.0 /100 | #12 | Exceptional $105,262 |
| Immigrants | Eastern Asia | 100.0 /100 | #13 | Exceptional $104,796 |
| Immigrants | Ireland | 100.0 /100 | #14 | Exceptional $104,692 |
| Immigrants | Israel | 100.0 /100 | #15 | Exceptional $104,090 |
| Burmese | 100.0 /100 | #16 | Exceptional $103,145 |
| Immigrants | Korea | 100.0 /100 | #17 | Exceptional $102,962 |
| Cypriots | 100.0 /100 | #18 | Exceptional $102,843 |
| Immigrants | Australia | 100.0 /100 | #19 | Exceptional $102,562 |