Honduran vs Indian (Asian) Median Male Earnings
COMPARE
Honduran
Indian (Asian)
Median Male Earnings
Median Male Earnings Comparison
Hondurans
Indians (Asian)
$46,374
MEDIAN MALE EARNINGS
0.0/ 100
METRIC RATING
313th/ 347
METRIC RANK
$66,078
MEDIAN MALE EARNINGS
100.0/ 100
METRIC RATING
18th/ 347
METRIC RANK
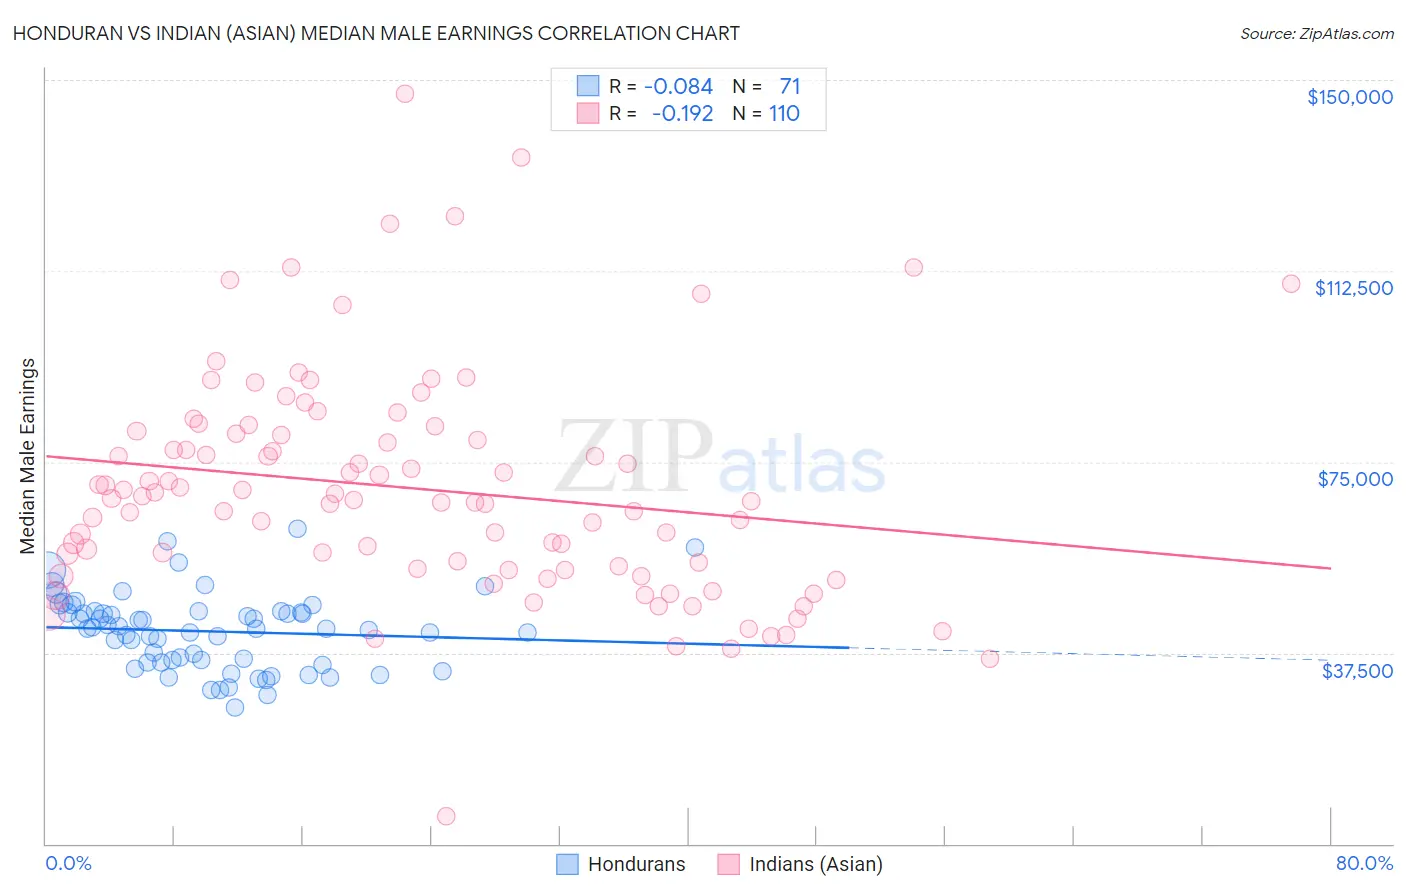
Honduran vs Indian (Asian) Median Male Earnings Correlation Chart
The statistical analysis conducted on geographies consisting of 357,792,552 people shows a slight negative correlation between the proportion of Hondurans and median male earnings in the United States with a correlation coefficient (R) of -0.084 and weighted average of $46,374. Similarly, the statistical analysis conducted on geographies consisting of 494,843,397 people shows a poor negative correlation between the proportion of Indians (Asian) and median male earnings in the United States with a correlation coefficient (R) of -0.192 and weighted average of $66,078, a difference of 42.5%.
Median Male Earnings Correlation Summary
| Measurement | Honduran | Indian (Asian) |
| Minimum | $26,786 | $5,439 |
| Maximum | $61,786 | $147,267 |
| Range | $35,000 | $141,828 |
| Mean | $41,717 | $69,730 |
| Median | $42,264 | $67,689 |
| Interquartile 25% (IQ1) | $35,639 | $53,972 |
| Interquartile 75% (IQ3) | $45,572 | $80,584 |
| Interquartile Range (IQR) | $9,933 | $26,612 |
| Standard Deviation (Sample) | $7,373 | $22,146 |
| Standard Deviation (Population) | $7,321 | $22,045 |
Similar Demographics by Median Male Earnings
Demographics Similar to Hondurans by Median Male Earnings
In terms of median male earnings, the demographic groups most similar to Hondurans are Chippewa ($46,368, a difference of 0.010%), Hispanic or Latino ($46,419, a difference of 0.10%), Apache ($46,429, a difference of 0.12%), Immigrants from Guatemala ($46,244, a difference of 0.28%), and Immigrants from Caribbean ($46,193, a difference of 0.39%).
| Demographics | Rating | Rank | Median Male Earnings |
| Dutch West Indians | 0.0 /100 | #306 | Tragic $46,656 |
| Immigrants | Dominican Republic | 0.0 /100 | #307 | Tragic $46,655 |
| Ottawa | 0.0 /100 | #308 | Tragic $46,611 |
| Creek | 0.0 /100 | #309 | Tragic $46,594 |
| Cubans | 0.0 /100 | #310 | Tragic $46,580 |
| Apache | 0.0 /100 | #311 | Tragic $46,429 |
| Hispanics or Latinos | 0.0 /100 | #312 | Tragic $46,419 |
| Hondurans | 0.0 /100 | #313 | Tragic $46,374 |
| Chippewa | 0.0 /100 | #314 | Tragic $46,368 |
| Immigrants | Guatemala | 0.0 /100 | #315 | Tragic $46,244 |
| Immigrants | Caribbean | 0.0 /100 | #316 | Tragic $46,193 |
| Mexicans | 0.0 /100 | #317 | Tragic $46,147 |
| Cheyenne | 0.0 /100 | #318 | Tragic $46,062 |
| Haitians | 0.0 /100 | #319 | Tragic $45,903 |
| Immigrants | Honduras | 0.0 /100 | #320 | Tragic $45,787 |
Demographics Similar to Indians (Asian) by Median Male Earnings
In terms of median male earnings, the demographic groups most similar to Indians (Asian) are Immigrants from Belgium ($66,125, a difference of 0.070%), Eastern European ($66,472, a difference of 0.60%), Cypriot ($65,549, a difference of 0.81%), Immigrants from Japan ($65,518, a difference of 0.85%), and Immigrants from Sweden ($65,406, a difference of 1.0%).
| Demographics | Rating | Rank | Median Male Earnings |
| Immigrants | Ireland | 100.0 /100 | #11 | Exceptional $67,698 |
| Immigrants | Australia | 100.0 /100 | #12 | Exceptional $67,634 |
| Immigrants | China | 100.0 /100 | #13 | Exceptional $67,353 |
| Okinawans | 100.0 /100 | #14 | Exceptional $67,232 |
| Immigrants | Eastern Asia | 100.0 /100 | #15 | Exceptional $66,903 |
| Eastern Europeans | 100.0 /100 | #16 | Exceptional $66,472 |
| Immigrants | Belgium | 100.0 /100 | #17 | Exceptional $66,125 |
| Indians (Asian) | 100.0 /100 | #18 | Exceptional $66,078 |
| Cypriots | 100.0 /100 | #19 | Exceptional $65,549 |
| Immigrants | Japan | 100.0 /100 | #20 | Exceptional $65,518 |
| Immigrants | Sweden | 100.0 /100 | #21 | Exceptional $65,406 |
| Burmese | 100.0 /100 | #22 | Exceptional $65,236 |
| Immigrants | Korea | 100.0 /100 | #23 | Exceptional $65,079 |
| Immigrants | Northern Europe | 100.0 /100 | #24 | Exceptional $64,987 |
| Immigrants | Denmark | 100.0 /100 | #25 | Exceptional $64,625 |