British vs Immigrants from Western Africa Male Unemployment
COMPARE
British
Immigrants from Western Africa
Male Unemployment
Male Unemployment Comparison
British
Immigrants from Western Africa
4.8%
MALE UNEMPLOYMENT
99.8/ 100
METRIC RATING
30th/ 347
METRIC RANK
6.2%
MALE UNEMPLOYMENT
0.0/ 100
METRIC RATING
283rd/ 347
METRIC RANK
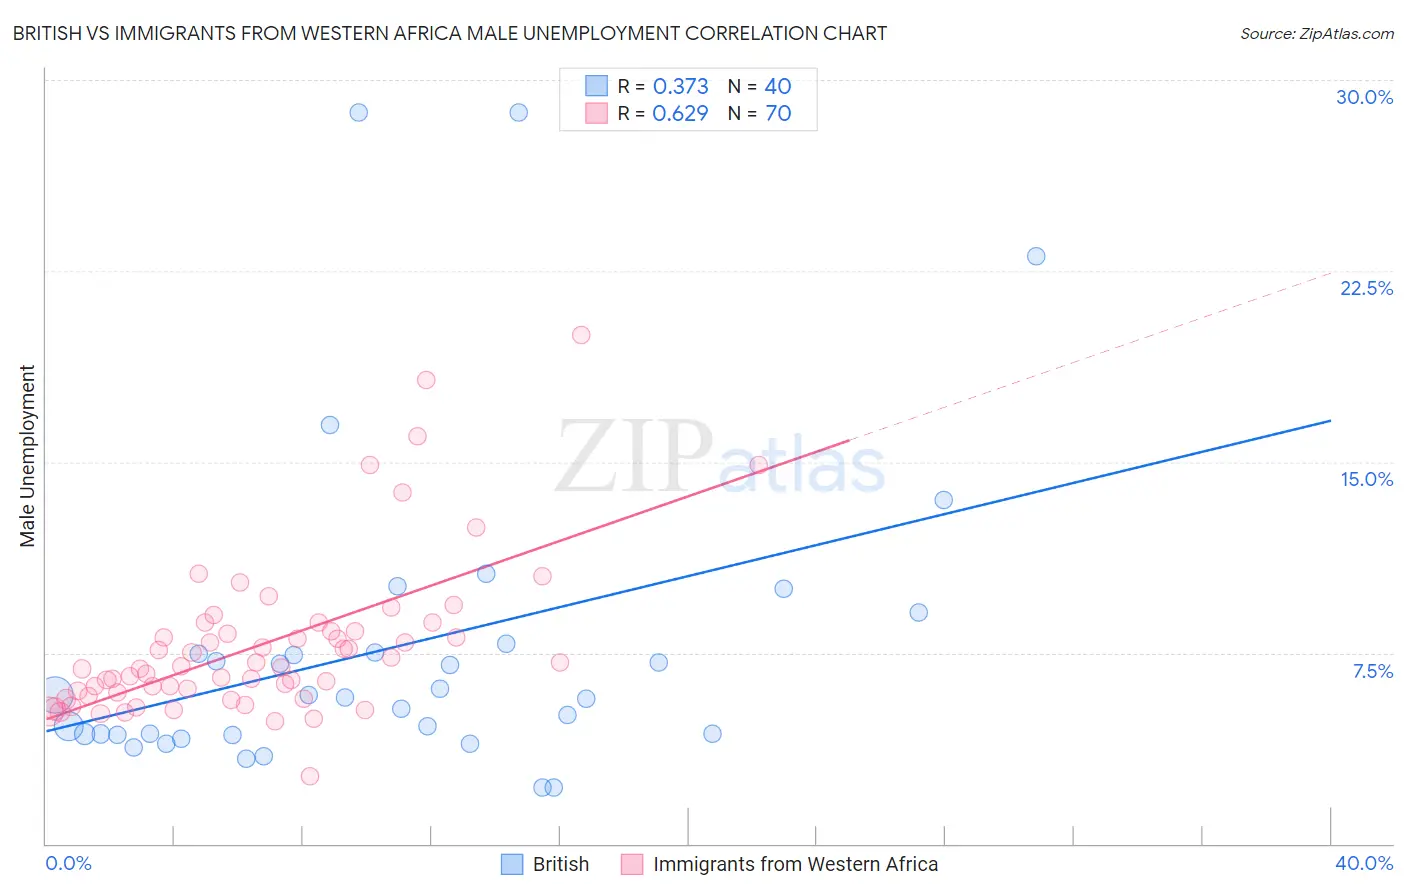
British vs Immigrants from Western Africa Male Unemployment Correlation Chart
The statistical analysis conducted on geographies consisting of 524,963,712 people shows a mild positive correlation between the proportion of British and unemployment rate among males in the United States with a correlation coefficient (R) of 0.373 and weighted average of 4.8%. Similarly, the statistical analysis conducted on geographies consisting of 356,888,506 people shows a significant positive correlation between the proportion of Immigrants from Western Africa and unemployment rate among males in the United States with a correlation coefficient (R) of 0.629 and weighted average of 6.2%, a difference of 28.4%.
Male Unemployment Correlation Summary
| Measurement | British | Immigrants from Western Africa |
| Minimum | 2.2% | 2.7% |
| Maximum | 28.7% | 20.0% |
| Range | 26.5% | 17.3% |
| Mean | 7.8% | 7.8% |
| Median | 5.8% | 7.0% |
| Interquartile 25% (IQ1) | 4.3% | 5.9% |
| Interquartile 75% (IQ3) | 7.7% | 8.3% |
| Interquartile Range (IQR) | 3.4% | 2.4% |
| Standard Deviation (Sample) | 6.3% | 3.1% |
| Standard Deviation (Population) | 6.2% | 3.1% |
Similar Demographics by Male Unemployment
Demographics Similar to British by Male Unemployment
In terms of male unemployment, the demographic groups most similar to British are Sudanese (4.8%, a difference of 0.25%), Immigrants from Nepal (4.8%, a difference of 0.26%), Scottish (4.8%, a difference of 0.31%), Bulgarian (4.8%, a difference of 0.44%), and Latvian (4.8%, a difference of 0.56%).
| Demographics | Rating | Rank | Male Unemployment |
| Tongans | 99.9 /100 | #23 | Exceptional 4.8% |
| Immigrants | South Central Asia | 99.9 /100 | #24 | Exceptional 4.8% |
| Zimbabweans | 99.9 /100 | #25 | Exceptional 4.8% |
| Dutch | 99.9 /100 | #26 | Exceptional 4.8% |
| Belgians | 99.9 /100 | #27 | Exceptional 4.8% |
| Bulgarians | 99.8 /100 | #28 | Exceptional 4.8% |
| Scottish | 99.8 /100 | #29 | Exceptional 4.8% |
| British | 99.8 /100 | #30 | Exceptional 4.8% |
| Sudanese | 99.8 /100 | #31 | Exceptional 4.8% |
| Immigrants | Nepal | 99.8 /100 | #32 | Exceptional 4.8% |
| Latvians | 99.7 /100 | #33 | Exceptional 4.8% |
| Welsh | 99.7 /100 | #34 | Exceptional 4.8% |
| Paraguayans | 99.5 /100 | #35 | Exceptional 4.9% |
| Immigrants | Singapore | 99.4 /100 | #36 | Exceptional 4.9% |
| Scotch-Irish | 99.4 /100 | #37 | Exceptional 4.9% |
Demographics Similar to Immigrants from Western Africa by Male Unemployment
In terms of male unemployment, the demographic groups most similar to Immigrants from Western Africa are Ecuadorian (6.2%, a difference of 0.030%), Sierra Leonean (6.2%, a difference of 0.46%), Immigrants from Ghana (6.2%, a difference of 0.53%), Spanish American Indian (6.2%, a difference of 0.65%), and Immigrants from Ecuador (6.2%, a difference of 0.67%).
| Demographics | Rating | Rank | Male Unemployment |
| Tlingit-Haida | 0.0 /100 | #276 | Tragic 6.0% |
| Immigrants | Liberia | 0.0 /100 | #277 | Tragic 6.1% |
| Immigrants | Fiji | 0.0 /100 | #278 | Tragic 6.1% |
| Ghanaians | 0.0 /100 | #279 | Tragic 6.1% |
| Immigrants | Ghana | 0.0 /100 | #280 | Tragic 6.2% |
| Sierra Leoneans | 0.0 /100 | #281 | Tragic 6.2% |
| Ecuadorians | 0.0 /100 | #282 | Tragic 6.2% |
| Immigrants | Western Africa | 0.0 /100 | #283 | Tragic 6.2% |
| Spanish American Indians | 0.0 /100 | #284 | Tragic 6.2% |
| Immigrants | Ecuador | 0.0 /100 | #285 | Tragic 6.2% |
| Africans | 0.0 /100 | #286 | Tragic 6.3% |
| Central American Indians | 0.0 /100 | #287 | Tragic 6.3% |
| Immigrants | Senegal | 0.0 /100 | #288 | Tragic 6.3% |
| Immigrants | Caribbean | 0.0 /100 | #289 | Tragic 6.3% |
| U.S. Virgin Islanders | 0.0 /100 | #290 | Tragic 6.4% |