Brazilian vs Immigrants from Western Africa Median Male Earnings
COMPARE
Brazilian
Immigrants from Western Africa
Median Male Earnings
Median Male Earnings Comparison
Brazilians
Immigrants from Western Africa
$56,837
MEDIAN MALE EARNINGS
90.9/ 100
METRIC RATING
127th/ 347
METRIC RANK
$50,940
MEDIAN MALE EARNINGS
3.0/ 100
METRIC RATING
235th/ 347
METRIC RANK
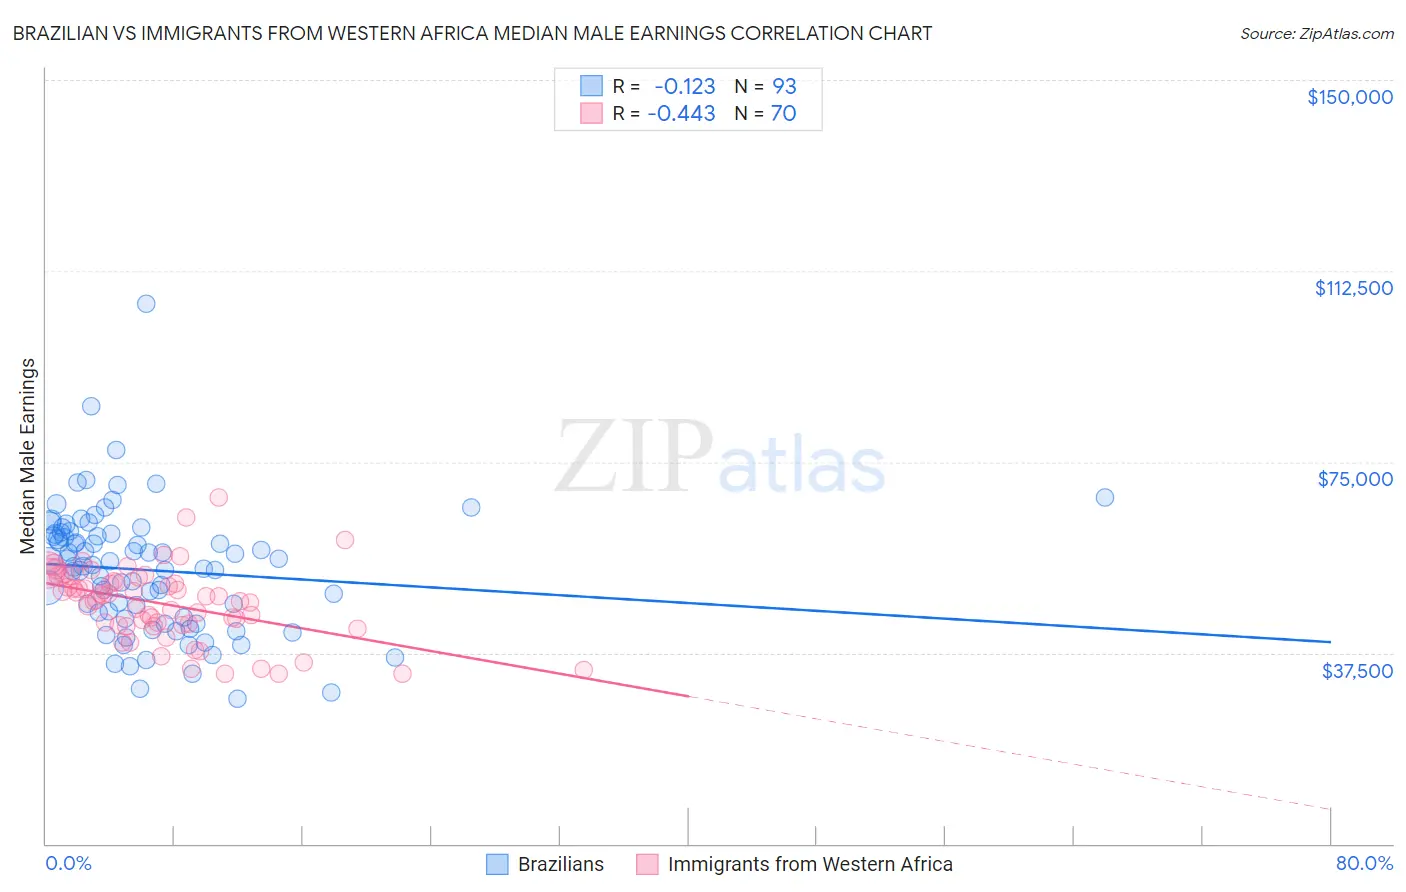
Brazilian vs Immigrants from Western Africa Median Male Earnings Correlation Chart
The statistical analysis conducted on geographies consisting of 323,892,839 people shows a poor negative correlation between the proportion of Brazilians and median male earnings in the United States with a correlation coefficient (R) of -0.123 and weighted average of $56,837. Similarly, the statistical analysis conducted on geographies consisting of 357,835,205 people shows a moderate negative correlation between the proportion of Immigrants from Western Africa and median male earnings in the United States with a correlation coefficient (R) of -0.443 and weighted average of $50,940, a difference of 11.6%.
Median Male Earnings Correlation Summary
| Measurement | Brazilian | Immigrants from Western Africa |
| Minimum | $28,554 | $33,371 |
| Maximum | $105,938 | $67,960 |
| Range | $77,384 | $34,589 |
| Mean | $53,733 | $47,183 |
| Median | $54,435 | $48,227 |
| Interquartile 25% (IQ1) | $44,298 | $42,968 |
| Interquartile 75% (IQ3) | $60,844 | $51,502 |
| Interquartile Range (IQR) | $16,546 | $8,534 |
| Standard Deviation (Sample) | $12,418 | $7,172 |
| Standard Deviation (Population) | $12,351 | $7,120 |
Similar Demographics by Median Male Earnings
Demographics Similar to Brazilians by Median Male Earnings
In terms of median male earnings, the demographic groups most similar to Brazilians are Immigrants from Syria ($56,830, a difference of 0.010%), Chinese ($56,872, a difference of 0.060%), Immigrants from Morocco ($56,958, a difference of 0.21%), Pakistani ($56,719, a difference of 0.21%), and Chilean ($56,973, a difference of 0.24%).
| Demographics | Rating | Rank | Median Male Earnings |
| Canadians | 93.9 /100 | #120 | Exceptional $57,286 |
| Immigrants | Albania | 93.3 /100 | #121 | Exceptional $57,179 |
| Immigrants | Jordan | 93.1 /100 | #122 | Exceptional $57,145 |
| Slovenes | 93.1 /100 | #123 | Exceptional $57,145 |
| Chileans | 91.9 /100 | #124 | Exceptional $56,973 |
| Immigrants | Morocco | 91.8 /100 | #125 | Exceptional $56,958 |
| Chinese | 91.1 /100 | #126 | Exceptional $56,872 |
| Brazilians | 90.9 /100 | #127 | Exceptional $56,837 |
| Immigrants | Syria | 90.8 /100 | #128 | Exceptional $56,830 |
| Pakistanis | 89.9 /100 | #129 | Excellent $56,719 |
| Koreans | 89.4 /100 | #130 | Excellent $56,672 |
| Portuguese | 89.4 /100 | #131 | Excellent $56,663 |
| Czechs | 88.2 /100 | #132 | Excellent $56,546 |
| Immigrants | Germany | 88.2 /100 | #133 | Excellent $56,542 |
| Moroccans | 87.7 /100 | #134 | Excellent $56,499 |
Demographics Similar to Immigrants from Western Africa by Median Male Earnings
In terms of median male earnings, the demographic groups most similar to Immigrants from Western Africa are Pennsylvania German ($50,878, a difference of 0.12%), Immigrants from Barbados ($50,795, a difference of 0.28%), Cape Verdean ($51,103, a difference of 0.32%), Malaysian ($50,772, a difference of 0.33%), and American ($50,761, a difference of 0.35%).
| Demographics | Rating | Rank | Median Male Earnings |
| Samoans | 4.6 /100 | #228 | Tragic $51,389 |
| Immigrants | Trinidad and Tobago | 4.5 /100 | #229 | Tragic $51,376 |
| Immigrants | Nigeria | 4.2 /100 | #230 | Tragic $51,310 |
| Barbadians | 3.9 /100 | #231 | Tragic $51,236 |
| Sudanese | 3.9 /100 | #232 | Tragic $51,216 |
| Aleuts | 3.7 /100 | #233 | Tragic $51,168 |
| Cape Verdeans | 3.5 /100 | #234 | Tragic $51,103 |
| Immigrants | Western Africa | 3.0 /100 | #235 | Tragic $50,940 |
| Pennsylvania Germans | 2.8 /100 | #236 | Tragic $50,878 |
| Immigrants | Barbados | 2.6 /100 | #237 | Tragic $50,795 |
| Malaysians | 2.5 /100 | #238 | Tragic $50,772 |
| Americans | 2.5 /100 | #239 | Tragic $50,761 |
| West Indians | 2.3 /100 | #240 | Tragic $50,682 |
| Immigrants | St. Vincent and the Grenadines | 2.3 /100 | #241 | Tragic $50,665 |
| Guyanese | 2.2 /100 | #242 | Tragic $50,613 |