Bolivian vs Immigrants from Thailand Median Earnings
COMPARE
Bolivian
Immigrants from Thailand
Median Earnings
Median Earnings Comparison
Bolivians
Immigrants from Thailand
$52,005
MEDIAN EARNINGS
100.0/ 100
METRIC RATING
49th/ 347
METRIC RANK
$45,598
MEDIAN EARNINGS
23.7/ 100
METRIC RATING
209th/ 347
METRIC RANK
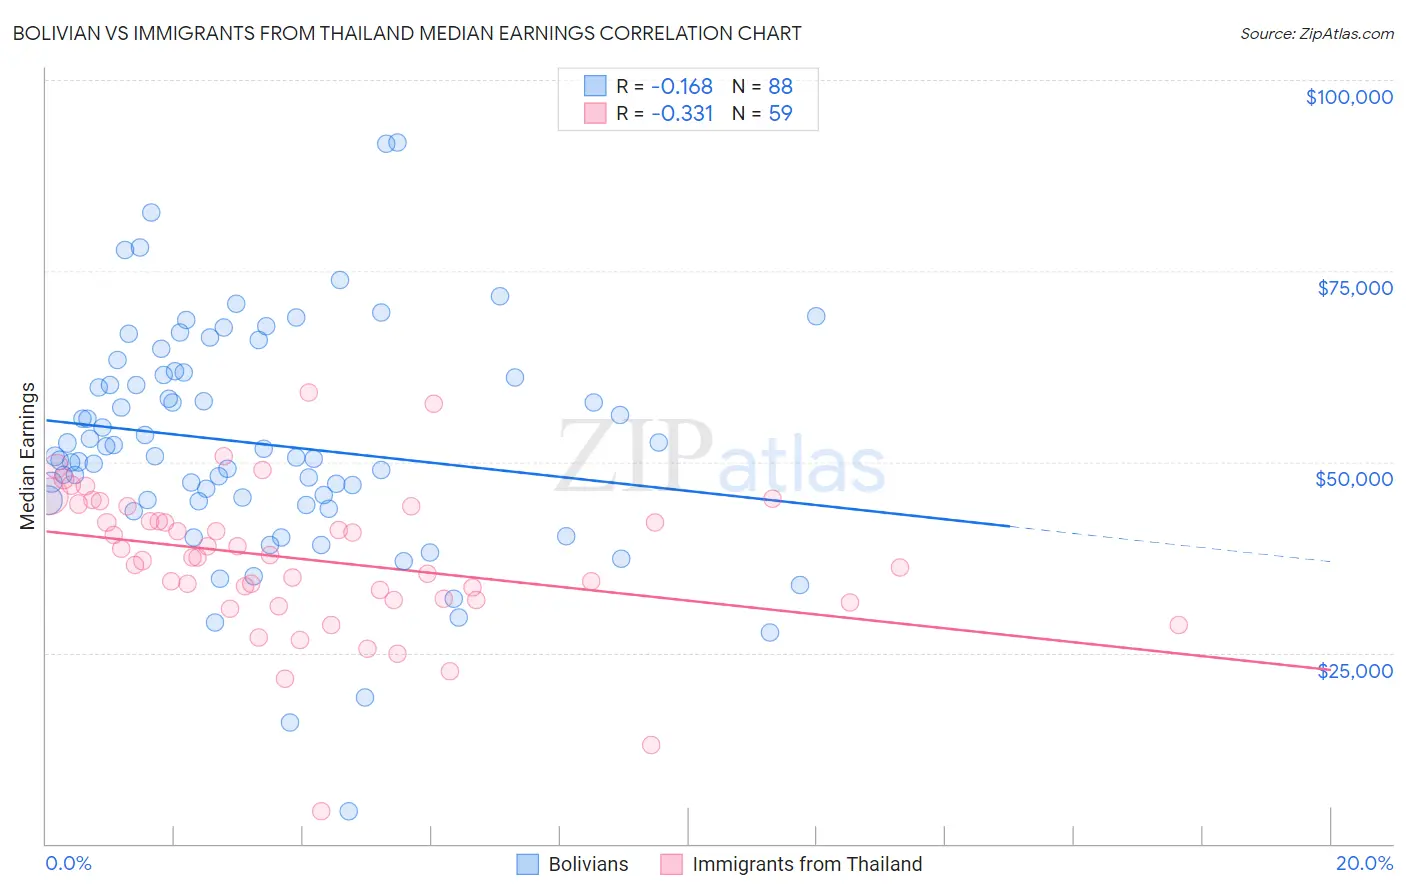
Bolivian vs Immigrants from Thailand Median Earnings Correlation Chart
The statistical analysis conducted on geographies consisting of 184,675,536 people shows a poor negative correlation between the proportion of Bolivians and median earnings in the United States with a correlation coefficient (R) of -0.168 and weighted average of $52,005. Similarly, the statistical analysis conducted on geographies consisting of 316,998,923 people shows a mild negative correlation between the proportion of Immigrants from Thailand and median earnings in the United States with a correlation coefficient (R) of -0.331 and weighted average of $45,598, a difference of 14.1%.
Median Earnings Correlation Summary
| Measurement | Bolivian | Immigrants from Thailand |
| Minimum | $4,250 | $4,250 |
| Maximum | $91,786 | $59,094 |
| Range | $87,536 | $54,844 |
| Mean | $52,342 | $37,184 |
| Median | $50,729 | $37,501 |
| Interquartile 25% (IQ1) | $44,853 | $31,980 |
| Interquartile 75% (IQ3) | $61,590 | $44,250 |
| Interquartile Range (IQR) | $16,737 | $12,270 |
| Standard Deviation (Sample) | $15,104 | $9,579 |
| Standard Deviation (Population) | $15,018 | $9,498 |
Similar Demographics by Median Earnings
Demographics Similar to Bolivians by Median Earnings
In terms of median earnings, the demographic groups most similar to Bolivians are Immigrants from South Africa ($51,850, a difference of 0.30%), Immigrants from Austria ($51,826, a difference of 0.35%), Immigrants from Europe ($52,195, a difference of 0.37%), Estonian ($51,772, a difference of 0.45%), and Immigrants from Norway ($51,758, a difference of 0.48%).
| Demographics | Rating | Rank | Median Earnings |
| Maltese | 100.0 /100 | #42 | Exceptional $52,526 |
| Immigrants | Malaysia | 100.0 /100 | #43 | Exceptional $52,514 |
| Bulgarians | 100.0 /100 | #44 | Exceptional $52,512 |
| Immigrants | Czechoslovakia | 100.0 /100 | #45 | Exceptional $52,361 |
| Bhutanese | 100.0 /100 | #46 | Exceptional $52,297 |
| Australians | 100.0 /100 | #47 | Exceptional $52,294 |
| Immigrants | Europe | 100.0 /100 | #48 | Exceptional $52,195 |
| Bolivians | 100.0 /100 | #49 | Exceptional $52,005 |
| Immigrants | South Africa | 100.0 /100 | #50 | Exceptional $51,850 |
| Immigrants | Austria | 99.9 /100 | #51 | Exceptional $51,826 |
| Estonians | 99.9 /100 | #52 | Exceptional $51,772 |
| Immigrants | Norway | 99.9 /100 | #53 | Exceptional $51,758 |
| Immigrants | Indonesia | 99.9 /100 | #54 | Exceptional $51,715 |
| Egyptians | 99.9 /100 | #55 | Exceptional $51,701 |
| Immigrants | Pakistan | 99.9 /100 | #56 | Exceptional $51,693 |
Demographics Similar to Immigrants from Thailand by Median Earnings
In terms of median earnings, the demographic groups most similar to Immigrants from Thailand are Immigrants from Bosnia and Herzegovina ($45,600, a difference of 0.0%), Immigrants from Grenada ($45,596, a difference of 0.0%), Panamanian ($45,593, a difference of 0.010%), Bermudan ($45,593, a difference of 0.010%), and Immigrants from Senegal ($45,611, a difference of 0.030%).
| Demographics | Rating | Rank | Median Earnings |
| Immigrants | Trinidad and Tobago | 27.1 /100 | #202 | Fair $45,729 |
| Welsh | 26.6 /100 | #203 | Fair $45,710 |
| Immigrants | Uruguay | 25.9 /100 | #204 | Fair $45,682 |
| Tongans | 25.4 /100 | #205 | Fair $45,665 |
| Immigrants | Ghana | 24.8 /100 | #206 | Fair $45,641 |
| Immigrants | Senegal | 24.0 /100 | #207 | Fair $45,611 |
| Immigrants | Bosnia and Herzegovina | 23.7 /100 | #208 | Fair $45,600 |
| Immigrants | Thailand | 23.7 /100 | #209 | Fair $45,598 |
| Immigrants | Grenada | 23.6 /100 | #210 | Fair $45,596 |
| Panamanians | 23.5 /100 | #211 | Fair $45,593 |
| Bermudans | 23.5 /100 | #212 | Fair $45,593 |
| Immigrants | Colombia | 22.4 /100 | #213 | Fair $45,550 |
| Nigerians | 22.0 /100 | #214 | Fair $45,532 |
| Immigrants | Bangladesh | 22.0 /100 | #215 | Fair $45,532 |
| Guyanese | 20.6 /100 | #216 | Fair $45,470 |