Black/African American vs Immigrants from Nepal Householder Income Ages 25 - 44 years
COMPARE
Black/African American
Immigrants from Nepal
Householder Income Ages 25 - 44 years
Householder Income Ages 25 - 44 years Comparison
Blacks/African Americans
Immigrants from Nepal
$73,370
HOUSEHOLDER INCOME AGES 25 - 44 YEARS
0.0/ 100
METRIC RATING
337th/ 347
METRIC RANK
$95,322
HOUSEHOLDER INCOME AGES 25 - 44 YEARS
60.3/ 100
METRIC RATING
165th/ 347
METRIC RANK
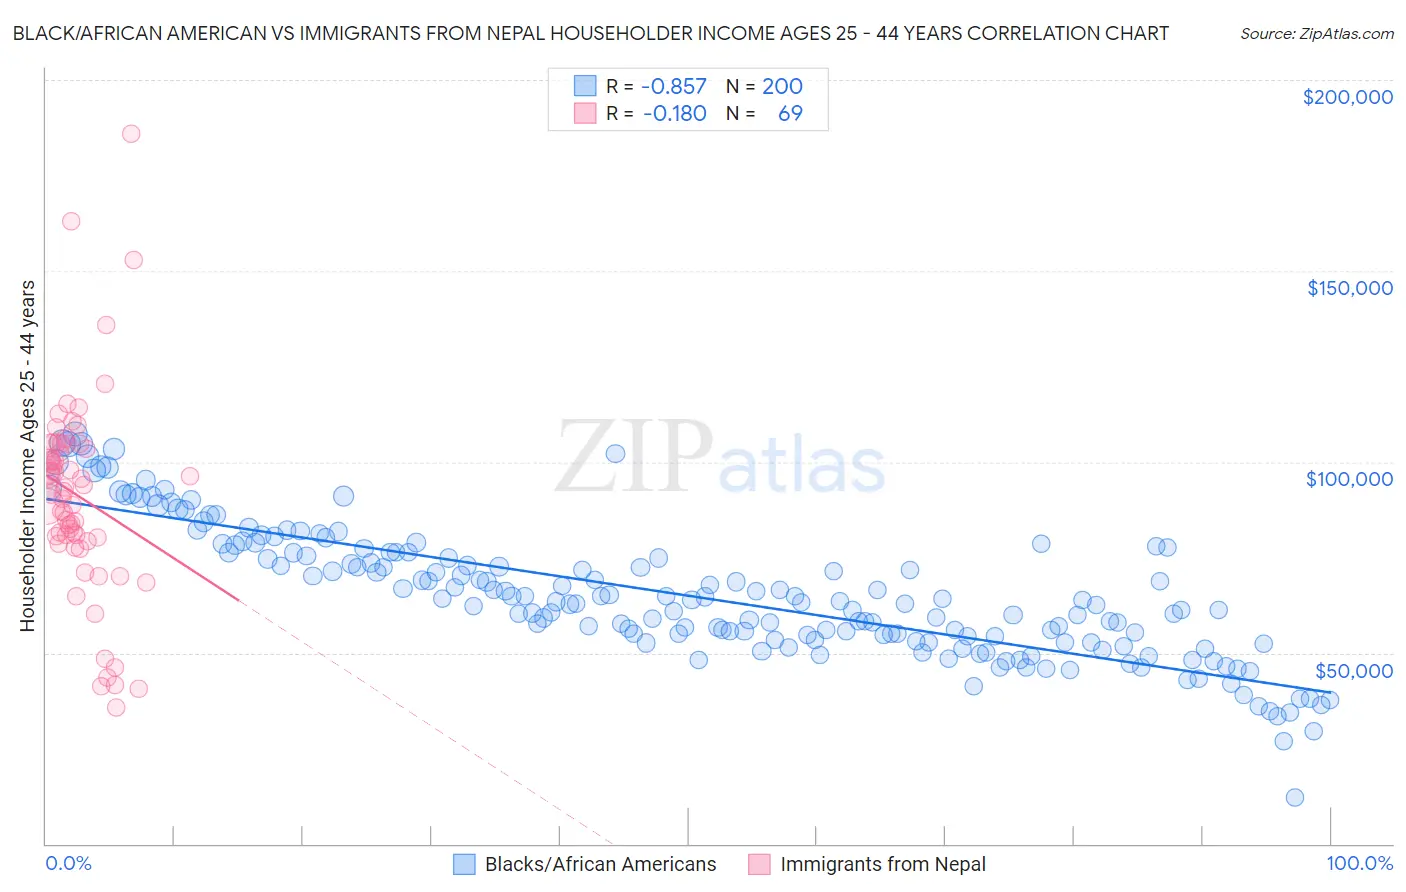
Black/African American vs Immigrants from Nepal Householder Income Ages 25 - 44 years Correlation Chart
The statistical analysis conducted on geographies consisting of 560,674,363 people shows a very strong negative correlation between the proportion of Blacks/African Americans and household income with householder between the ages 25 and 44 in the United States with a correlation coefficient (R) of -0.857 and weighted average of $73,370. Similarly, the statistical analysis conducted on geographies consisting of 186,599,325 people shows a poor negative correlation between the proportion of Immigrants from Nepal and household income with householder between the ages 25 and 44 in the United States with a correlation coefficient (R) of -0.180 and weighted average of $95,322, a difference of 29.9%.
Householder Income Ages 25 - 44 years Correlation Summary
| Measurement | Black/African American | Immigrants from Nepal |
| Minimum | $12,048 | $35,521 |
| Maximum | $107,395 | $185,946 |
| Range | $95,347 | $150,425 |
| Mean | $64,936 | $91,020 |
| Median | $63,200 | $92,147 |
| Interquartile 25% (IQ1) | $53,277 | $79,685 |
| Interquartile 75% (IQ3) | $76,198 | $104,696 |
| Interquartile Range (IQR) | $22,921 | $25,011 |
| Standard Deviation (Sample) | $17,118 | $26,432 |
| Standard Deviation (Population) | $17,075 | $26,240 |
Similar Demographics by Householder Income Ages 25 - 44 years
Demographics Similar to Blacks/African Americans by Householder Income Ages 25 - 44 years
In terms of householder income ages 25 - 44 years, the demographic groups most similar to Blacks/African Americans are Yup'ik ($73,688, a difference of 0.43%), Immigrants from Yemen ($73,043, a difference of 0.45%), Yuman ($72,956, a difference of 0.57%), Immigrants from Congo ($72,178, a difference of 1.7%), and Kiowa ($74,776, a difference of 1.9%).
| Demographics | Rating | Rank | Householder Income Ages 25 - 44 years |
| Yakama | 0.0 /100 | #330 | Tragic $76,226 |
| Natives/Alaskans | 0.0 /100 | #331 | Tragic $75,647 |
| Bahamians | 0.0 /100 | #332 | Tragic $75,395 |
| Hopi | 0.0 /100 | #333 | Tragic $75,002 |
| Creek | 0.0 /100 | #334 | Tragic $74,847 |
| Kiowa | 0.0 /100 | #335 | Tragic $74,776 |
| Yup'ik | 0.0 /100 | #336 | Tragic $73,688 |
| Blacks/African Americans | 0.0 /100 | #337 | Tragic $73,370 |
| Immigrants | Yemen | 0.0 /100 | #338 | Tragic $73,043 |
| Yuman | 0.0 /100 | #339 | Tragic $72,956 |
| Immigrants | Congo | 0.0 /100 | #340 | Tragic $72,178 |
| Arapaho | 0.0 /100 | #341 | Tragic $71,697 |
| Crow | 0.0 /100 | #342 | Tragic $71,337 |
| Tohono O'odham | 0.0 /100 | #343 | Tragic $69,068 |
| Pueblo | 0.0 /100 | #344 | Tragic $68,910 |
Demographics Similar to Immigrants from Nepal by Householder Income Ages 25 - 44 years
In terms of householder income ages 25 - 44 years, the demographic groups most similar to Immigrants from Nepal are South American ($95,362, a difference of 0.040%), Immigrants from Ethiopia ($95,256, a difference of 0.070%), Immigrants from Saudi Arabia ($95,450, a difference of 0.13%), Immigrants from Portugal ($95,512, a difference of 0.20%), and Swiss ($95,511, a difference of 0.20%).
| Demographics | Rating | Rank | Householder Income Ages 25 - 44 years |
| Scandinavians | 63.9 /100 | #158 | Good $95,596 |
| Costa Ricans | 63.5 /100 | #159 | Good $95,565 |
| Icelanders | 63.4 /100 | #160 | Good $95,560 |
| Immigrants | Portugal | 62.8 /100 | #161 | Good $95,512 |
| Swiss | 62.8 /100 | #162 | Good $95,511 |
| Immigrants | Saudi Arabia | 62.0 /100 | #163 | Good $95,450 |
| South Americans | 60.9 /100 | #164 | Good $95,362 |
| Immigrants | Nepal | 60.3 /100 | #165 | Good $95,322 |
| Immigrants | Ethiopia | 59.5 /100 | #166 | Average $95,256 |
| Czechoslovakians | 57.0 /100 | #167 | Average $95,070 |
| Alsatians | 56.8 /100 | #168 | Average $95,059 |
| Native Hawaiians | 56.8 /100 | #169 | Average $95,058 |
| Slovaks | 56.4 /100 | #170 | Average $95,032 |
| Immigrants | Armenia | 54.2 /100 | #171 | Average $94,867 |
| Scottish | 50.8 /100 | #172 | Average $94,622 |