Immigrants from Uruguay vs Immigrants from Nepal Householder Income Ages 25 - 44 years
COMPARE
Immigrants from Uruguay
Immigrants from Nepal
Householder Income Ages 25 - 44 years
Householder Income Ages 25 - 44 years Comparison
Immigrants from Uruguay
Immigrants from Nepal
$91,171
HOUSEHOLDER INCOME AGES 25 - 44 YEARS
13.2/ 100
METRIC RATING
209th/ 347
METRIC RANK
$95,322
HOUSEHOLDER INCOME AGES 25 - 44 YEARS
60.3/ 100
METRIC RATING
165th/ 347
METRIC RANK
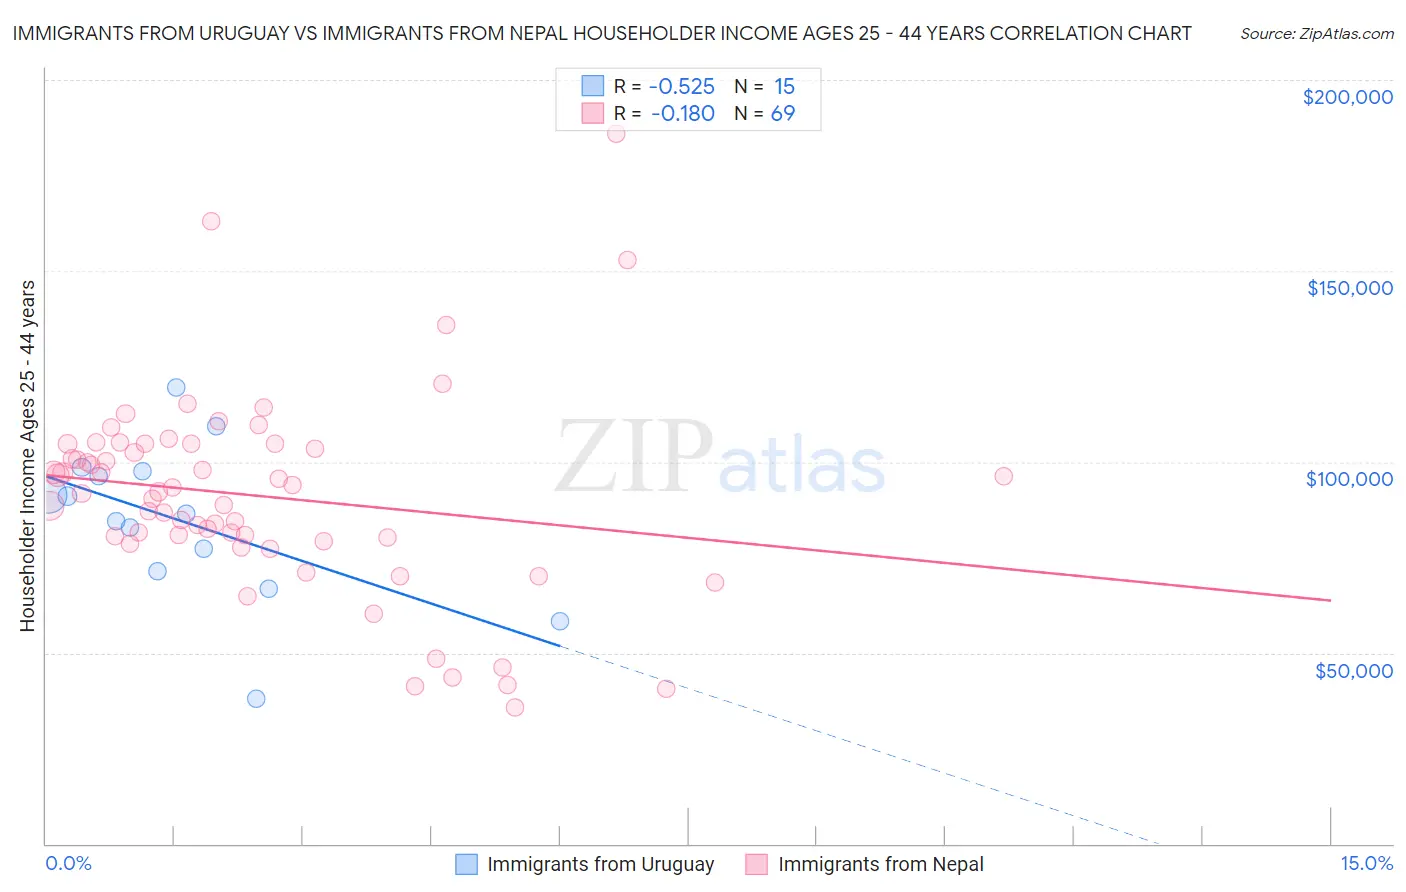
Immigrants from Uruguay vs Immigrants from Nepal Householder Income Ages 25 - 44 years Correlation Chart
The statistical analysis conducted on geographies consisting of 133,181,410 people shows a substantial negative correlation between the proportion of Immigrants from Uruguay and household income with householder between the ages 25 and 44 in the United States with a correlation coefficient (R) of -0.525 and weighted average of $91,171. Similarly, the statistical analysis conducted on geographies consisting of 186,599,325 people shows a poor negative correlation between the proportion of Immigrants from Nepal and household income with householder between the ages 25 and 44 in the United States with a correlation coefficient (R) of -0.180 and weighted average of $95,322, a difference of 4.5%.
Householder Income Ages 25 - 44 years Correlation Summary
| Measurement | Immigrants from Uruguay | Immigrants from Nepal |
| Minimum | $38,006 | $35,521 |
| Maximum | $119,559 | $185,946 |
| Range | $81,553 | $150,425 |
| Mean | $84,577 | $91,020 |
| Median | $86,424 | $92,147 |
| Interquartile 25% (IQ1) | $71,202 | $79,685 |
| Interquartile 75% (IQ3) | $97,689 | $104,696 |
| Interquartile Range (IQR) | $26,487 | $25,011 |
| Standard Deviation (Sample) | $20,417 | $26,432 |
| Standard Deviation (Population) | $19,725 | $26,240 |
Similar Demographics by Householder Income Ages 25 - 44 years
Demographics Similar to Immigrants from Uruguay by Householder Income Ages 25 - 44 years
In terms of householder income ages 25 - 44 years, the demographic groups most similar to Immigrants from Uruguay are Immigrants from Thailand ($91,337, a difference of 0.18%), Aleut ($91,370, a difference of 0.22%), Yugoslavian ($91,368, a difference of 0.22%), Immigrants from Eastern Africa ($91,458, a difference of 0.32%), and Nepalese ($91,498, a difference of 0.36%).
| Demographics | Rating | Rank | Householder Income Ages 25 - 44 years |
| Ecuadorians | 16.0 /100 | #202 | Poor $91,574 |
| Immigrants | Cambodia | 15.7 /100 | #203 | Poor $91,533 |
| Nepalese | 15.4 /100 | #204 | Poor $91,498 |
| Immigrants | Eastern Africa | 15.2 /100 | #205 | Poor $91,458 |
| Aleuts | 14.5 /100 | #206 | Poor $91,370 |
| Yugoslavians | 14.5 /100 | #207 | Poor $91,368 |
| Immigrants | Thailand | 14.3 /100 | #208 | Poor $91,337 |
| Immigrants | Uruguay | 13.2 /100 | #209 | Poor $91,171 |
| Immigrants | Kenya | 10.9 /100 | #210 | Poor $90,767 |
| Iraqis | 10.8 /100 | #211 | Poor $90,764 |
| Hawaiians | 10.6 /100 | #212 | Poor $90,722 |
| Immigrants | Bangladesh | 9.3 /100 | #213 | Tragic $90,448 |
| Immigrants | Africa | 8.9 /100 | #214 | Tragic $90,372 |
| Panamanians | 8.1 /100 | #215 | Tragic $90,193 |
| Ghanaians | 7.9 /100 | #216 | Tragic $90,137 |
Demographics Similar to Immigrants from Nepal by Householder Income Ages 25 - 44 years
In terms of householder income ages 25 - 44 years, the demographic groups most similar to Immigrants from Nepal are South American ($95,362, a difference of 0.040%), Immigrants from Ethiopia ($95,256, a difference of 0.070%), Immigrants from Saudi Arabia ($95,450, a difference of 0.13%), Immigrants from Portugal ($95,512, a difference of 0.20%), and Swiss ($95,511, a difference of 0.20%).
| Demographics | Rating | Rank | Householder Income Ages 25 - 44 years |
| Scandinavians | 63.9 /100 | #158 | Good $95,596 |
| Costa Ricans | 63.5 /100 | #159 | Good $95,565 |
| Icelanders | 63.4 /100 | #160 | Good $95,560 |
| Immigrants | Portugal | 62.8 /100 | #161 | Good $95,512 |
| Swiss | 62.8 /100 | #162 | Good $95,511 |
| Immigrants | Saudi Arabia | 62.0 /100 | #163 | Good $95,450 |
| South Americans | 60.9 /100 | #164 | Good $95,362 |
| Immigrants | Nepal | 60.3 /100 | #165 | Good $95,322 |
| Immigrants | Ethiopia | 59.5 /100 | #166 | Average $95,256 |
| Czechoslovakians | 57.0 /100 | #167 | Average $95,070 |
| Alsatians | 56.8 /100 | #168 | Average $95,059 |
| Native Hawaiians | 56.8 /100 | #169 | Average $95,058 |
| Slovaks | 56.4 /100 | #170 | Average $95,032 |
| Immigrants | Armenia | 54.2 /100 | #171 | Average $94,867 |
| Scottish | 50.8 /100 | #172 | Average $94,622 |