Salvadoran vs Immigrants from Nepal Householder Income Ages 25 - 44 years
COMPARE
Salvadoran
Immigrants from Nepal
Householder Income Ages 25 - 44 years
Householder Income Ages 25 - 44 years Comparison
Salvadorans
Immigrants from Nepal
$88,198
HOUSEHOLDER INCOME AGES 25 - 44 YEARS
2.8/ 100
METRIC RATING
237th/ 347
METRIC RANK
$95,322
HOUSEHOLDER INCOME AGES 25 - 44 YEARS
60.3/ 100
METRIC RATING
165th/ 347
METRIC RANK
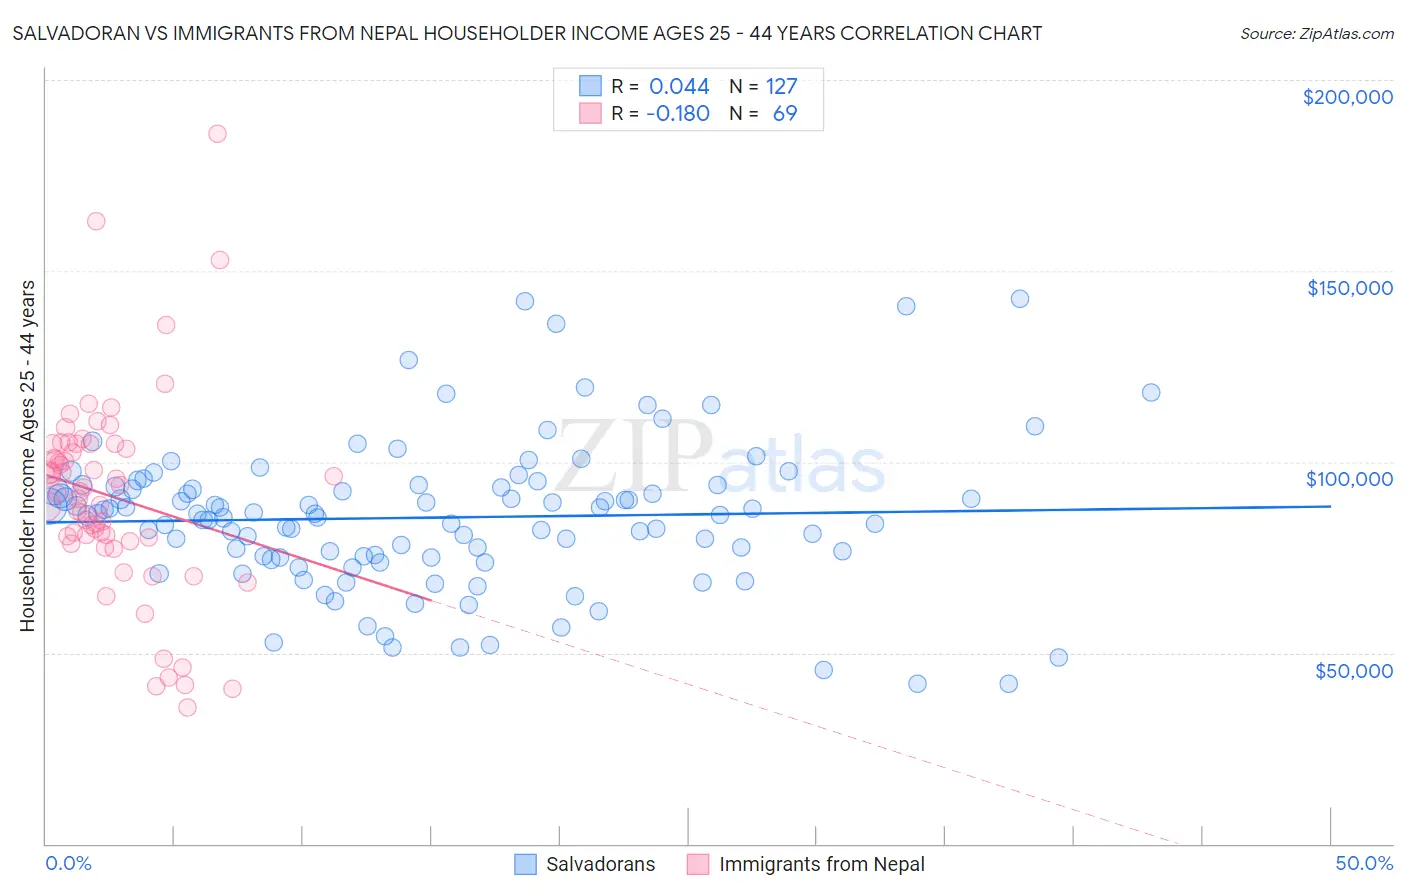
Salvadoran vs Immigrants from Nepal Householder Income Ages 25 - 44 years Correlation Chart
The statistical analysis conducted on geographies consisting of 398,111,832 people shows no correlation between the proportion of Salvadorans and household income with householder between the ages 25 and 44 in the United States with a correlation coefficient (R) of 0.044 and weighted average of $88,198. Similarly, the statistical analysis conducted on geographies consisting of 186,599,325 people shows a poor negative correlation between the proportion of Immigrants from Nepal and household income with householder between the ages 25 and 44 in the United States with a correlation coefficient (R) of -0.180 and weighted average of $95,322, a difference of 8.1%.
Householder Income Ages 25 - 44 years Correlation Summary
| Measurement | Salvadoran | Immigrants from Nepal |
| Minimum | $41,885 | $35,521 |
| Maximum | $142,639 | $185,946 |
| Range | $100,754 | $150,425 |
| Mean | $85,407 | $91,020 |
| Median | $86,364 | $92,147 |
| Interquartile 25% (IQ1) | $74,962 | $79,685 |
| Interquartile 75% (IQ3) | $93,567 | $104,696 |
| Interquartile Range (IQR) | $18,605 | $25,011 |
| Standard Deviation (Sample) | $18,999 | $26,432 |
| Standard Deviation (Population) | $18,924 | $26,240 |
Similar Demographics by Householder Income Ages 25 - 44 years
Demographics Similar to Salvadorans by Householder Income Ages 25 - 44 years
In terms of householder income ages 25 - 44 years, the demographic groups most similar to Salvadorans are Immigrants from Cameroon ($88,214, a difference of 0.020%), Venezuelan ($88,232, a difference of 0.040%), Bermudan ($88,231, a difference of 0.040%), Malaysian ($88,291, a difference of 0.11%), and Nonimmigrants ($88,301, a difference of 0.12%).
| Demographics | Rating | Rank | Householder Income Ages 25 - 44 years |
| Alaskan Athabascans | 3.3 /100 | #230 | Tragic $88,446 |
| Immigrants | Grenada | 3.0 /100 | #231 | Tragic $88,311 |
| Immigrants | Nonimmigrants | 3.0 /100 | #232 | Tragic $88,301 |
| Malaysians | 3.0 /100 | #233 | Tragic $88,291 |
| Venezuelans | 2.9 /100 | #234 | Tragic $88,232 |
| Bermudans | 2.9 /100 | #235 | Tragic $88,231 |
| Immigrants | Cameroon | 2.9 /100 | #236 | Tragic $88,214 |
| Salvadorans | 2.8 /100 | #237 | Tragic $88,198 |
| Alaska Natives | 2.6 /100 | #238 | Tragic $88,018 |
| Immigrants | Ghana | 2.2 /100 | #239 | Tragic $87,760 |
| Nicaraguans | 2.2 /100 | #240 | Tragic $87,751 |
| Nigerians | 2.2 /100 | #241 | Tragic $87,730 |
| West Indians | 1.7 /100 | #242 | Tragic $87,205 |
| Immigrants | West Indies | 1.5 /100 | #243 | Tragic $87,063 |
| Immigrants | Venezuela | 1.5 /100 | #244 | Tragic $87,038 |
Demographics Similar to Immigrants from Nepal by Householder Income Ages 25 - 44 years
In terms of householder income ages 25 - 44 years, the demographic groups most similar to Immigrants from Nepal are South American ($95,362, a difference of 0.040%), Immigrants from Ethiopia ($95,256, a difference of 0.070%), Immigrants from Saudi Arabia ($95,450, a difference of 0.13%), Immigrants from Portugal ($95,512, a difference of 0.20%), and Swiss ($95,511, a difference of 0.20%).
| Demographics | Rating | Rank | Householder Income Ages 25 - 44 years |
| Scandinavians | 63.9 /100 | #158 | Good $95,596 |
| Costa Ricans | 63.5 /100 | #159 | Good $95,565 |
| Icelanders | 63.4 /100 | #160 | Good $95,560 |
| Immigrants | Portugal | 62.8 /100 | #161 | Good $95,512 |
| Swiss | 62.8 /100 | #162 | Good $95,511 |
| Immigrants | Saudi Arabia | 62.0 /100 | #163 | Good $95,450 |
| South Americans | 60.9 /100 | #164 | Good $95,362 |
| Immigrants | Nepal | 60.3 /100 | #165 | Good $95,322 |
| Immigrants | Ethiopia | 59.5 /100 | #166 | Average $95,256 |
| Czechoslovakians | 57.0 /100 | #167 | Average $95,070 |
| Alsatians | 56.8 /100 | #168 | Average $95,059 |
| Native Hawaiians | 56.8 /100 | #169 | Average $95,058 |
| Slovaks | 56.4 /100 | #170 | Average $95,032 |
| Immigrants | Armenia | 54.2 /100 | #171 | Average $94,867 |
| Scottish | 50.8 /100 | #172 | Average $94,622 |