Black/African American vs West Indian Householder Income Ages 25 - 44 years
COMPARE
Black/African American
West Indian
Householder Income Ages 25 - 44 years
Householder Income Ages 25 - 44 years Comparison
Blacks/African Americans
West Indians
$73,370
HOUSEHOLDER INCOME AGES 25 - 44 YEARS
0.0/ 100
METRIC RATING
337th/ 347
METRIC RANK
$87,205
HOUSEHOLDER INCOME AGES 25 - 44 YEARS
1.7/ 100
METRIC RATING
242nd/ 347
METRIC RANK
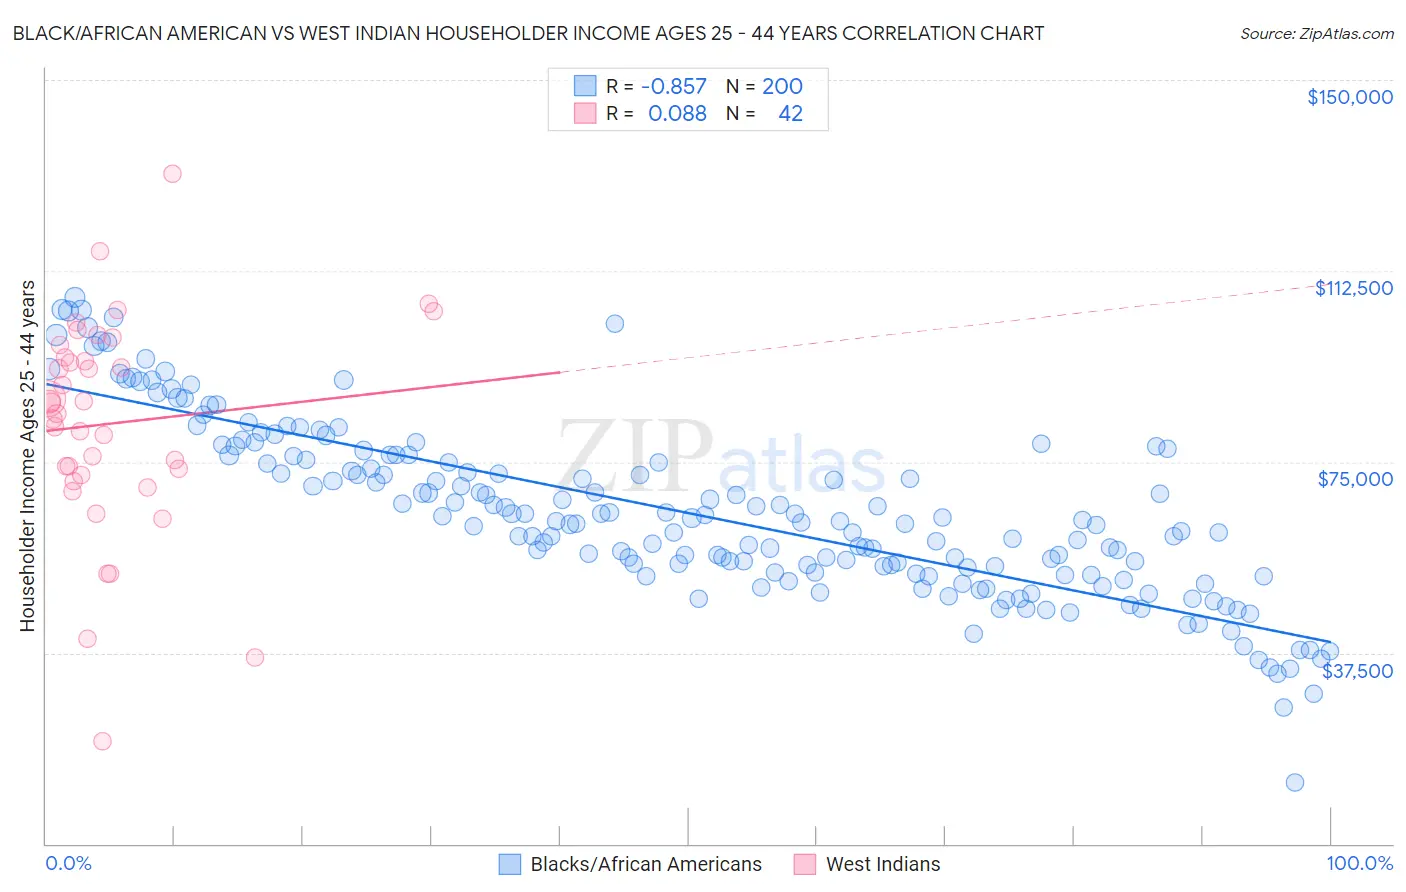
Black/African American vs West Indian Householder Income Ages 25 - 44 years Correlation Chart
The statistical analysis conducted on geographies consisting of 560,674,363 people shows a very strong negative correlation between the proportion of Blacks/African Americans and household income with householder between the ages 25 and 44 in the United States with a correlation coefficient (R) of -0.857 and weighted average of $73,370. Similarly, the statistical analysis conducted on geographies consisting of 253,630,243 people shows a slight positive correlation between the proportion of West Indians and household income with householder between the ages 25 and 44 in the United States with a correlation coefficient (R) of 0.088 and weighted average of $87,205, a difference of 18.9%.
Householder Income Ages 25 - 44 years Correlation Summary
| Measurement | Black/African American | West Indian |
| Minimum | $12,048 | $20,234 |
| Maximum | $107,395 | $131,705 |
| Range | $95,347 | $111,471 |
| Mean | $64,936 | $82,528 |
| Median | $63,200 | $85,571 |
| Interquartile 25% (IQ1) | $53,277 | $72,417 |
| Interquartile 75% (IQ3) | $76,198 | $95,404 |
| Interquartile Range (IQR) | $22,921 | $22,987 |
| Standard Deviation (Sample) | $17,118 | $21,318 |
| Standard Deviation (Population) | $17,075 | $21,063 |
Similar Demographics by Householder Income Ages 25 - 44 years
Demographics Similar to Blacks/African Americans by Householder Income Ages 25 - 44 years
In terms of householder income ages 25 - 44 years, the demographic groups most similar to Blacks/African Americans are Yup'ik ($73,688, a difference of 0.43%), Immigrants from Yemen ($73,043, a difference of 0.45%), Yuman ($72,956, a difference of 0.57%), Immigrants from Congo ($72,178, a difference of 1.7%), and Kiowa ($74,776, a difference of 1.9%).
| Demographics | Rating | Rank | Householder Income Ages 25 - 44 years |
| Yakama | 0.0 /100 | #330 | Tragic $76,226 |
| Natives/Alaskans | 0.0 /100 | #331 | Tragic $75,647 |
| Bahamians | 0.0 /100 | #332 | Tragic $75,395 |
| Hopi | 0.0 /100 | #333 | Tragic $75,002 |
| Creek | 0.0 /100 | #334 | Tragic $74,847 |
| Kiowa | 0.0 /100 | #335 | Tragic $74,776 |
| Yup'ik | 0.0 /100 | #336 | Tragic $73,688 |
| Blacks/African Americans | 0.0 /100 | #337 | Tragic $73,370 |
| Immigrants | Yemen | 0.0 /100 | #338 | Tragic $73,043 |
| Yuman | 0.0 /100 | #339 | Tragic $72,956 |
| Immigrants | Congo | 0.0 /100 | #340 | Tragic $72,178 |
| Arapaho | 0.0 /100 | #341 | Tragic $71,697 |
| Crow | 0.0 /100 | #342 | Tragic $71,337 |
| Tohono O'odham | 0.0 /100 | #343 | Tragic $69,068 |
| Pueblo | 0.0 /100 | #344 | Tragic $68,910 |
Demographics Similar to West Indians by Householder Income Ages 25 - 44 years
In terms of householder income ages 25 - 44 years, the demographic groups most similar to West Indians are Immigrants from West Indies ($87,063, a difference of 0.16%), Immigrants from Venezuela ($87,038, a difference of 0.19%), Immigrants from El Salvador ($86,913, a difference of 0.34%), Immigrants from Burma/Myanmar ($86,736, a difference of 0.54%), and Nigerian ($87,730, a difference of 0.60%).
| Demographics | Rating | Rank | Householder Income Ages 25 - 44 years |
| Bermudans | 2.9 /100 | #235 | Tragic $88,231 |
| Immigrants | Cameroon | 2.9 /100 | #236 | Tragic $88,214 |
| Salvadorans | 2.8 /100 | #237 | Tragic $88,198 |
| Alaska Natives | 2.6 /100 | #238 | Tragic $88,018 |
| Immigrants | Ghana | 2.2 /100 | #239 | Tragic $87,760 |
| Nicaraguans | 2.2 /100 | #240 | Tragic $87,751 |
| Nigerians | 2.2 /100 | #241 | Tragic $87,730 |
| West Indians | 1.7 /100 | #242 | Tragic $87,205 |
| Immigrants | West Indies | 1.5 /100 | #243 | Tragic $87,063 |
| Immigrants | Venezuela | 1.5 /100 | #244 | Tragic $87,038 |
| Immigrants | El Salvador | 1.4 /100 | #245 | Tragic $86,913 |
| Immigrants | Burma/Myanmar | 1.3 /100 | #246 | Tragic $86,736 |
| Immigrants | Nigeria | 1.2 /100 | #247 | Tragic $86,589 |
| Immigrants | Sudan | 0.9 /100 | #248 | Tragic $86,109 |
| French American Indians | 0.8 /100 | #249 | Tragic $85,899 |