Swiss vs Ugandan Median Earnings
COMPARE
Swiss
Ugandan
Median Earnings
Median Earnings Comparison
Swiss
Ugandans
$46,315
MEDIAN EARNINGS
45.9/ 100
METRIC RATING
182nd/ 347
METRIC RANK
$47,854
MEDIAN EARNINGS
88.0/ 100
METRIC RATING
142nd/ 347
METRIC RANK
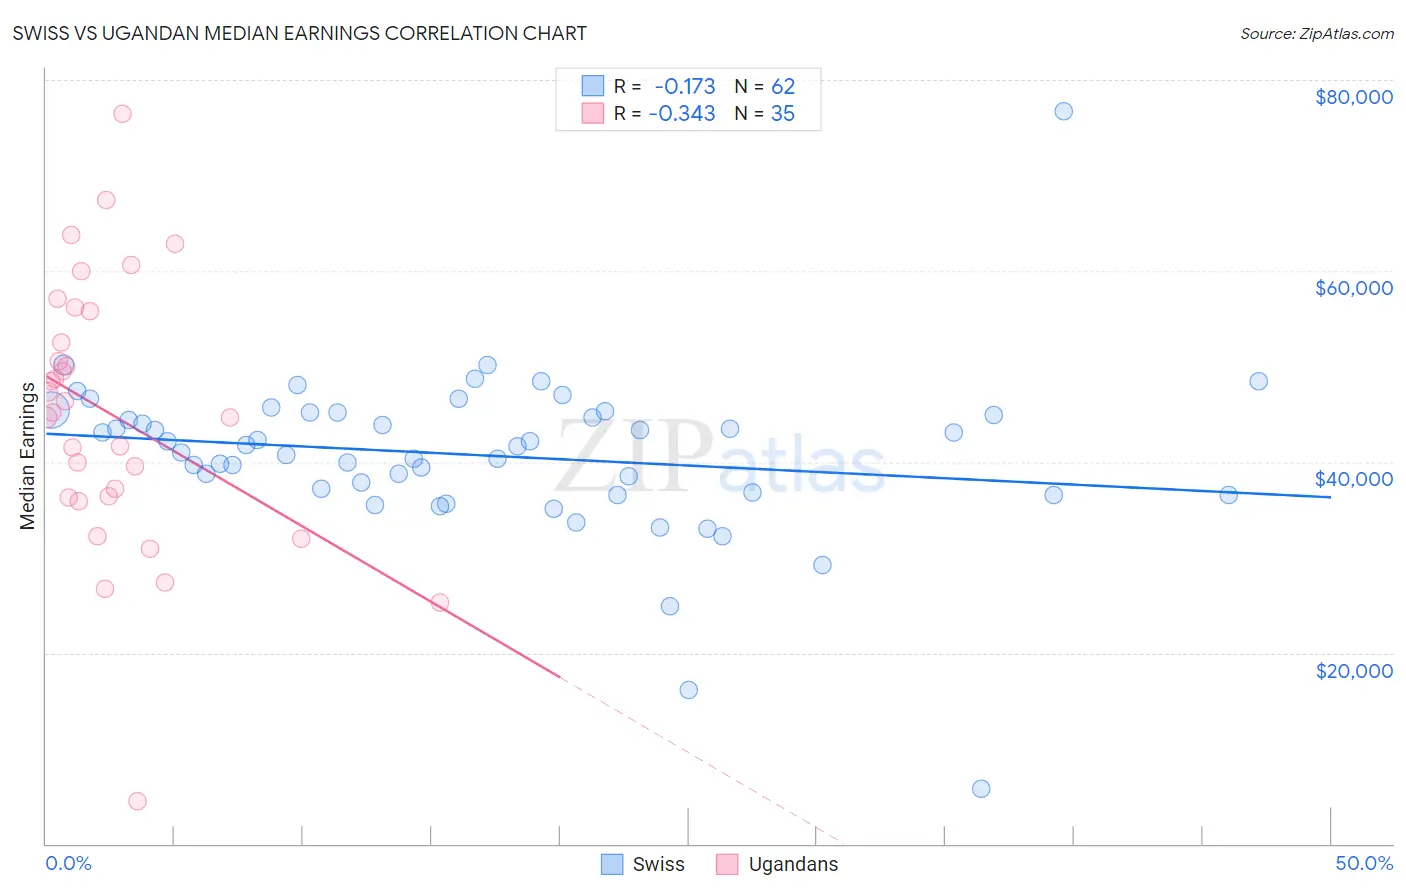
Swiss vs Ugandan Median Earnings Correlation Chart
The statistical analysis conducted on geographies consisting of 464,919,245 people shows a poor negative correlation between the proportion of Swiss and median earnings in the United States with a correlation coefficient (R) of -0.173 and weighted average of $46,315. Similarly, the statistical analysis conducted on geographies consisting of 94,012,409 people shows a mild negative correlation between the proportion of Ugandans and median earnings in the United States with a correlation coefficient (R) of -0.343 and weighted average of $47,854, a difference of 3.3%.
Median Earnings Correlation Summary
| Measurement | Swiss | Ugandan |
| Minimum | $5,729 | $4,426 |
| Maximum | $76,771 | $76,513 |
| Range | $71,042 | $72,087 |
| Mean | $40,710 | $45,002 |
| Median | $41,698 | $45,167 |
| Interquartile 25% (IQ1) | $36,797 | $36,215 |
| Interquartile 75% (IQ3) | $45,132 | $55,750 |
| Interquartile Range (IQR) | $8,335 | $19,535 |
| Standard Deviation (Sample) | $8,837 | $14,118 |
| Standard Deviation (Population) | $8,765 | $13,915 |
Similar Demographics by Median Earnings
Demographics Similar to Swiss by Median Earnings
In terms of median earnings, the demographic groups most similar to Swiss are Immigrants from Cameroon ($46,329, a difference of 0.030%), English ($46,334, a difference of 0.040%), Puget Sound Salish ($46,333, a difference of 0.040%), French ($46,296, a difference of 0.040%), and Colombian ($46,349, a difference of 0.070%).
| Demographics | Rating | Rank | Median Earnings |
| Basques | 48.8 /100 | #175 | Average $46,399 |
| Danes | 48.6 /100 | #176 | Average $46,392 |
| Belgians | 48.0 /100 | #177 | Average $46,375 |
| Colombians | 47.1 /100 | #178 | Average $46,349 |
| English | 46.5 /100 | #179 | Average $46,334 |
| Puget Sound Salish | 46.5 /100 | #180 | Average $46,333 |
| Immigrants | Cameroon | 46.4 /100 | #181 | Average $46,329 |
| Swiss | 45.9 /100 | #182 | Average $46,315 |
| French | 45.2 /100 | #183 | Average $46,296 |
| Immigrants | Kenya | 42.4 /100 | #184 | Average $46,214 |
| Uruguayans | 41.6 /100 | #185 | Average $46,190 |
| Vietnamese | 40.9 /100 | #186 | Average $46,172 |
| Iraqis | 39.9 /100 | #187 | Fair $46,140 |
| Immigrants | Armenia | 38.3 /100 | #188 | Fair $46,094 |
| Spaniards | 37.2 /100 | #189 | Fair $46,059 |
Demographics Similar to Ugandans by Median Earnings
In terms of median earnings, the demographic groups most similar to Ugandans are Swedish ($47,851, a difference of 0.010%), Immigrants from Sierra Leone ($47,875, a difference of 0.040%), Taiwanese ($47,902, a difference of 0.10%), Canadian ($47,911, a difference of 0.12%), and Hungarian ($47,795, a difference of 0.12%).
| Demographics | Rating | Rank | Median Earnings |
| Portuguese | 90.4 /100 | #135 | Exceptional $48,032 |
| Slovenes | 90.0 /100 | #136 | Excellent $47,995 |
| Immigrants | Nepal | 89.0 /100 | #137 | Excellent $47,925 |
| Europeans | 88.9 /100 | #138 | Excellent $47,915 |
| Canadians | 88.8 /100 | #139 | Excellent $47,911 |
| Taiwanese | 88.7 /100 | #140 | Excellent $47,902 |
| Immigrants | Sierra Leone | 88.3 /100 | #141 | Excellent $47,875 |
| Ugandans | 88.0 /100 | #142 | Excellent $47,854 |
| Swedes | 88.0 /100 | #143 | Excellent $47,851 |
| Hungarians | 87.1 /100 | #144 | Excellent $47,795 |
| Immigrants | Saudi Arabia | 85.6 /100 | #145 | Excellent $47,704 |
| Immigrants | Chile | 85.5 /100 | #146 | Excellent $47,697 |
| Immigrants | South Eastern Asia | 85.0 /100 | #147 | Excellent $47,671 |
| Immigrants | Eritrea | 84.8 /100 | #148 | Excellent $47,657 |
| Luxembourgers | 84.5 /100 | #149 | Excellent $47,640 |