Aleut vs Hispanic or Latino Median Male Earnings
COMPARE
Aleut
Hispanic or Latino
Median Male Earnings
Median Male Earnings Comparison
Aleuts
Hispanics or Latinos
$51,168
MEDIAN MALE EARNINGS
3.7/ 100
METRIC RATING
233rd/ 347
METRIC RANK
$46,419
MEDIAN MALE EARNINGS
0.0/ 100
METRIC RATING
312th/ 347
METRIC RANK
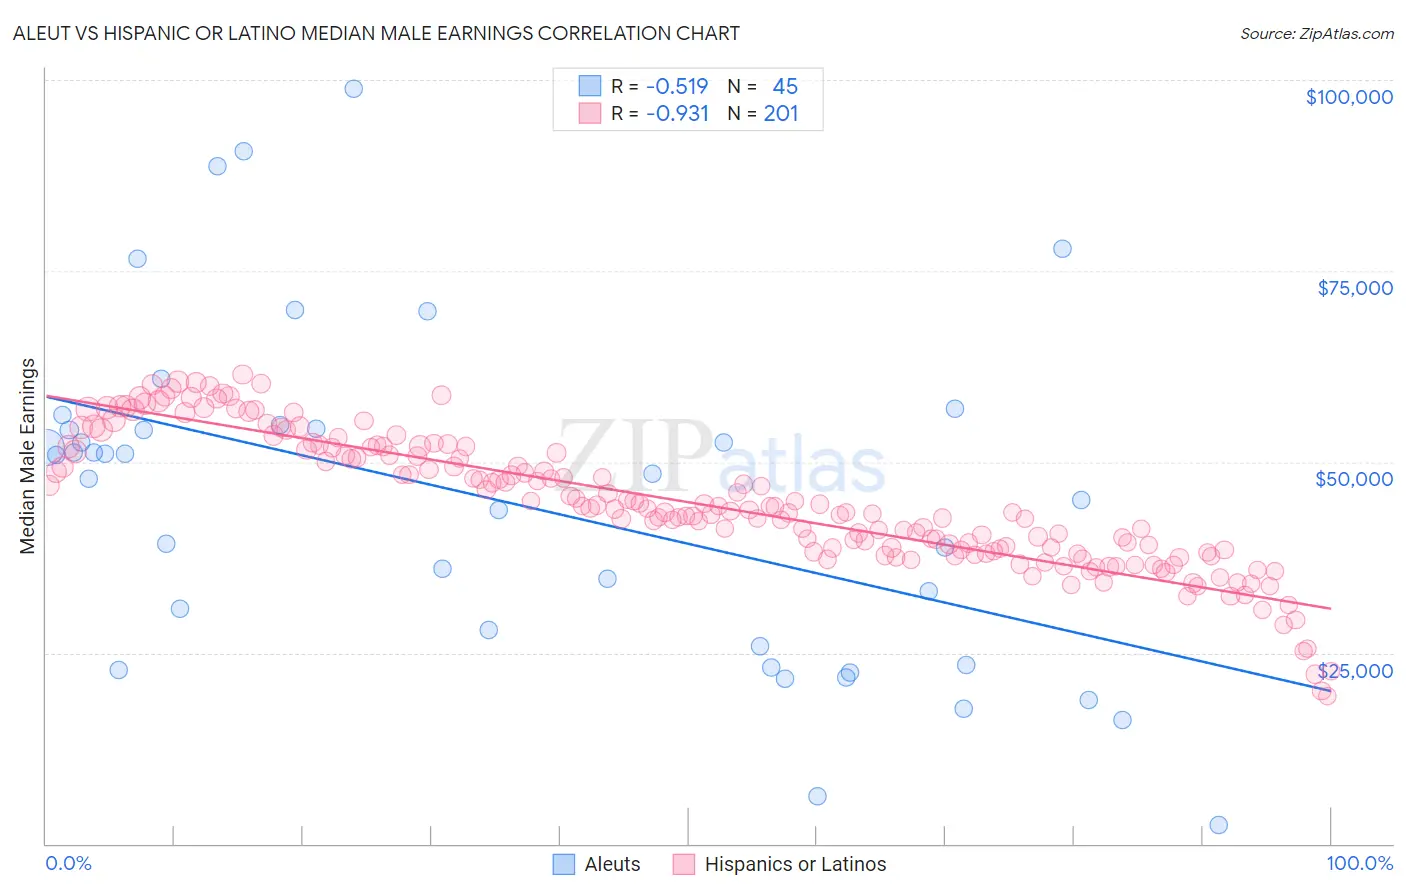
Aleut vs Hispanic or Latino Median Male Earnings Correlation Chart
The statistical analysis conducted on geographies consisting of 61,765,699 people shows a substantial negative correlation between the proportion of Aleuts and median male earnings in the United States with a correlation coefficient (R) of -0.519 and weighted average of $51,168. Similarly, the statistical analysis conducted on geographies consisting of 577,008,191 people shows a near-perfect negative correlation between the proportion of Hispanics or Latinos and median male earnings in the United States with a correlation coefficient (R) of -0.931 and weighted average of $46,419, a difference of 10.2%.
Median Male Earnings Correlation Summary
| Measurement | Aleut | Hispanic or Latino |
| Minimum | $2,499 | $19,304 |
| Maximum | $98,906 | $61,420 |
| Range | $96,407 | $42,115 |
| Mean | $44,984 | $44,646 |
| Median | $48,500 | $43,909 |
| Interquartile 25% (IQ1) | $24,583 | $38,393 |
| Interquartile 75% (IQ3) | $54,582 | $51,713 |
| Interquartile Range (IQR) | $29,999 | $13,320 |
| Standard Deviation (Sample) | $22,008 | $8,708 |
| Standard Deviation (Population) | $21,762 | $8,686 |
Similar Demographics by Median Male Earnings
Demographics Similar to Aleuts by Median Male Earnings
In terms of median male earnings, the demographic groups most similar to Aleuts are Sudanese ($51,216, a difference of 0.090%), Barbadian ($51,236, a difference of 0.13%), Cape Verdean ($51,103, a difference of 0.13%), Immigrants from Nigeria ($51,310, a difference of 0.28%), and Immigrants from Trinidad and Tobago ($51,376, a difference of 0.41%).
| Demographics | Rating | Rank | Median Male Earnings |
| Japanese | 4.9 /100 | #226 | Tragic $51,473 |
| Trinidadians and Tobagonians | 4.8 /100 | #227 | Tragic $51,446 |
| Samoans | 4.6 /100 | #228 | Tragic $51,389 |
| Immigrants | Trinidad and Tobago | 4.5 /100 | #229 | Tragic $51,376 |
| Immigrants | Nigeria | 4.2 /100 | #230 | Tragic $51,310 |
| Barbadians | 3.9 /100 | #231 | Tragic $51,236 |
| Sudanese | 3.9 /100 | #232 | Tragic $51,216 |
| Aleuts | 3.7 /100 | #233 | Tragic $51,168 |
| Cape Verdeans | 3.5 /100 | #234 | Tragic $51,103 |
| Immigrants | Western Africa | 3.0 /100 | #235 | Tragic $50,940 |
| Pennsylvania Germans | 2.8 /100 | #236 | Tragic $50,878 |
| Immigrants | Barbados | 2.6 /100 | #237 | Tragic $50,795 |
| Malaysians | 2.5 /100 | #238 | Tragic $50,772 |
| Americans | 2.5 /100 | #239 | Tragic $50,761 |
| West Indians | 2.3 /100 | #240 | Tragic $50,682 |
Demographics Similar to Hispanics or Latinos by Median Male Earnings
In terms of median male earnings, the demographic groups most similar to Hispanics or Latinos are Apache ($46,429, a difference of 0.020%), Honduran ($46,374, a difference of 0.10%), Chippewa ($46,368, a difference of 0.11%), Cuban ($46,580, a difference of 0.35%), and Creek ($46,594, a difference of 0.38%).
| Demographics | Rating | Rank | Median Male Earnings |
| Guatemalans | 0.0 /100 | #305 | Tragic $46,736 |
| Dutch West Indians | 0.0 /100 | #306 | Tragic $46,656 |
| Immigrants | Dominican Republic | 0.0 /100 | #307 | Tragic $46,655 |
| Ottawa | 0.0 /100 | #308 | Tragic $46,611 |
| Creek | 0.0 /100 | #309 | Tragic $46,594 |
| Cubans | 0.0 /100 | #310 | Tragic $46,580 |
| Apache | 0.0 /100 | #311 | Tragic $46,429 |
| Hispanics or Latinos | 0.0 /100 | #312 | Tragic $46,419 |
| Hondurans | 0.0 /100 | #313 | Tragic $46,374 |
| Chippewa | 0.0 /100 | #314 | Tragic $46,368 |
| Immigrants | Guatemala | 0.0 /100 | #315 | Tragic $46,244 |
| Immigrants | Caribbean | 0.0 /100 | #316 | Tragic $46,193 |
| Mexicans | 0.0 /100 | #317 | Tragic $46,147 |
| Cheyenne | 0.0 /100 | #318 | Tragic $46,062 |
| Haitians | 0.0 /100 | #319 | Tragic $45,903 |