Afghan vs Brazilian Median Male Earnings
COMPARE
Afghan
Brazilian
Median Male Earnings
Median Male Earnings Comparison
Afghans
Brazilians
$59,554
MEDIAN MALE EARNINGS
99.3/ 100
METRIC RATING
84th/ 347
METRIC RANK
$56,837
MEDIAN MALE EARNINGS
90.9/ 100
METRIC RATING
127th/ 347
METRIC RANK
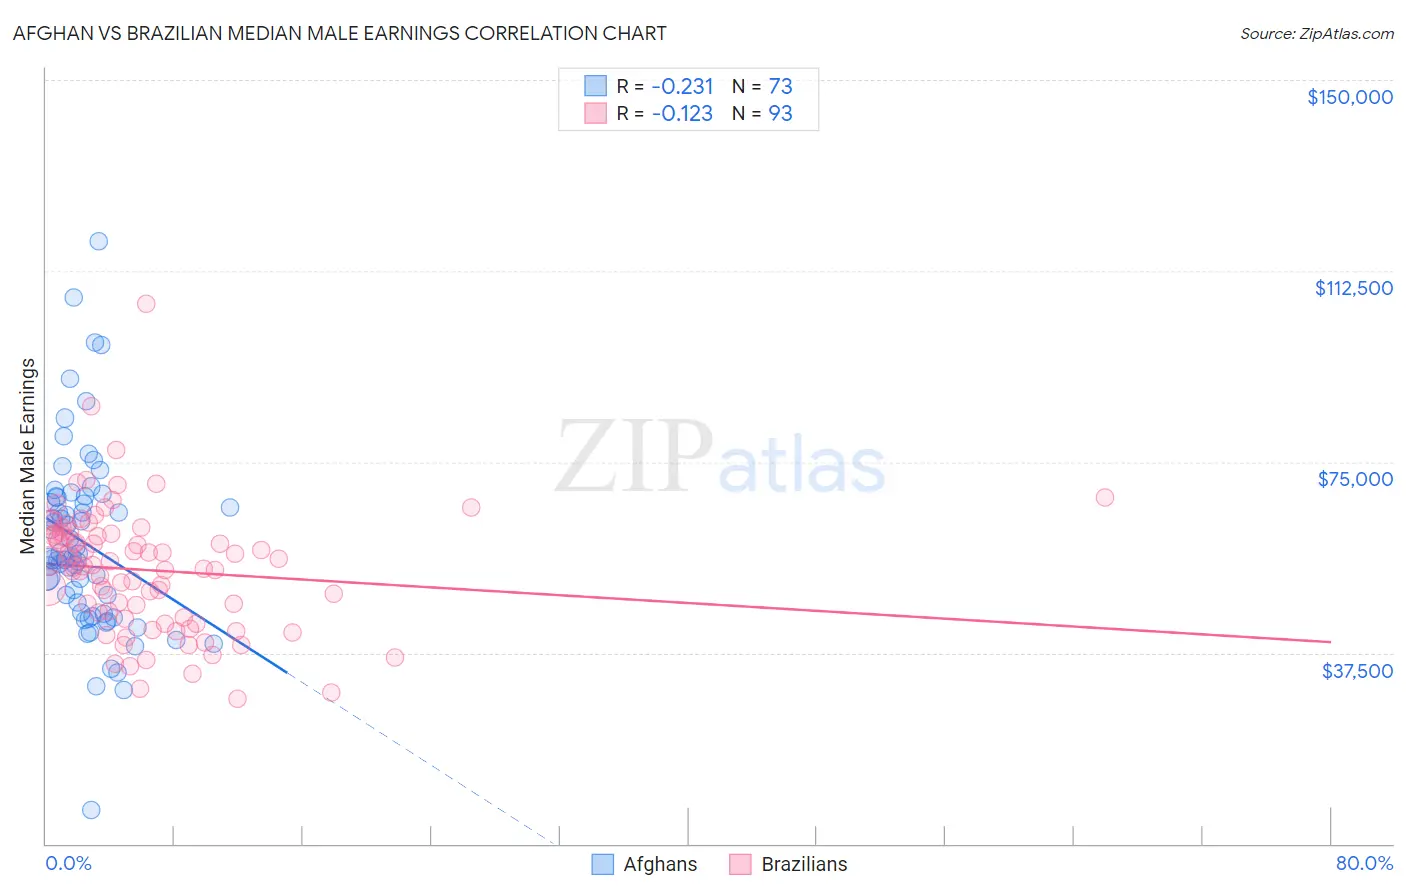
Afghan vs Brazilian Median Male Earnings Correlation Chart
The statistical analysis conducted on geographies consisting of 148,869,100 people shows a weak negative correlation between the proportion of Afghans and median male earnings in the United States with a correlation coefficient (R) of -0.231 and weighted average of $59,554. Similarly, the statistical analysis conducted on geographies consisting of 323,892,839 people shows a poor negative correlation between the proportion of Brazilians and median male earnings in the United States with a correlation coefficient (R) of -0.123 and weighted average of $56,837, a difference of 4.8%.
Median Male Earnings Correlation Summary
| Measurement | Afghan | Brazilian |
| Minimum | $6,707 | $28,554 |
| Maximum | $118,365 | $105,938 |
| Range | $111,658 | $77,384 |
| Mean | $59,002 | $53,733 |
| Median | $56,261 | $54,435 |
| Interquartile 25% (IQ1) | $45,293 | $44,298 |
| Interquartile 75% (IQ3) | $68,035 | $60,844 |
| Interquartile Range (IQR) | $22,742 | $16,546 |
| Standard Deviation (Sample) | $18,269 | $12,418 |
| Standard Deviation (Population) | $18,144 | $12,351 |
Similar Demographics by Median Male Earnings
Demographics Similar to Afghans by Median Male Earnings
In terms of median male earnings, the demographic groups most similar to Afghans are Italian ($59,551, a difference of 0.0%), Immigrants from England ($59,527, a difference of 0.050%), Macedonian ($59,522, a difference of 0.050%), Immigrants from Argentina ($59,491, a difference of 0.11%), and Immigrants from Italy ($59,691, a difference of 0.23%).
| Demographics | Rating | Rank | Median Male Earnings |
| Paraguayans | 99.5 /100 | #77 | Exceptional $59,975 |
| Immigrants | Egypt | 99.5 /100 | #78 | Exceptional $59,925 |
| Immigrants | Ukraine | 99.5 /100 | #79 | Exceptional $59,820 |
| Immigrants | Hungary | 99.5 /100 | #80 | Exceptional $59,806 |
| Ukrainians | 99.4 /100 | #81 | Exceptional $59,728 |
| Croatians | 99.4 /100 | #82 | Exceptional $59,715 |
| Immigrants | Italy | 99.4 /100 | #83 | Exceptional $59,691 |
| Afghans | 99.3 /100 | #84 | Exceptional $59,554 |
| Italians | 99.3 /100 | #85 | Exceptional $59,551 |
| Immigrants | England | 99.3 /100 | #86 | Exceptional $59,527 |
| Macedonians | 99.3 /100 | #87 | Exceptional $59,522 |
| Immigrants | Argentina | 99.3 /100 | #88 | Exceptional $59,491 |
| Immigrants | Moldova | 99.2 /100 | #89 | Exceptional $59,417 |
| Austrians | 99.2 /100 | #90 | Exceptional $59,359 |
| Laotians | 99.2 /100 | #91 | Exceptional $59,351 |
Demographics Similar to Brazilians by Median Male Earnings
In terms of median male earnings, the demographic groups most similar to Brazilians are Immigrants from Syria ($56,830, a difference of 0.010%), Chinese ($56,872, a difference of 0.060%), Immigrants from Morocco ($56,958, a difference of 0.21%), Pakistani ($56,719, a difference of 0.21%), and Chilean ($56,973, a difference of 0.24%).
| Demographics | Rating | Rank | Median Male Earnings |
| Canadians | 93.9 /100 | #120 | Exceptional $57,286 |
| Immigrants | Albania | 93.3 /100 | #121 | Exceptional $57,179 |
| Immigrants | Jordan | 93.1 /100 | #122 | Exceptional $57,145 |
| Slovenes | 93.1 /100 | #123 | Exceptional $57,145 |
| Chileans | 91.9 /100 | #124 | Exceptional $56,973 |
| Immigrants | Morocco | 91.8 /100 | #125 | Exceptional $56,958 |
| Chinese | 91.1 /100 | #126 | Exceptional $56,872 |
| Brazilians | 90.9 /100 | #127 | Exceptional $56,837 |
| Immigrants | Syria | 90.8 /100 | #128 | Exceptional $56,830 |
| Pakistanis | 89.9 /100 | #129 | Excellent $56,719 |
| Koreans | 89.4 /100 | #130 | Excellent $56,672 |
| Portuguese | 89.4 /100 | #131 | Excellent $56,663 |
| Czechs | 88.2 /100 | #132 | Excellent $56,546 |
| Immigrants | Germany | 88.2 /100 | #133 | Excellent $56,542 |
| Moroccans | 87.7 /100 | #134 | Excellent $56,499 |