Belizean vs Immigrants from Japan Per Capita Income
COMPARE
Belizean
Immigrants from Japan
Per Capita Income
Per Capita Income Comparison
Belizeans
Immigrants from Japan
$39,097
PER CAPITA INCOME
0.6/ 100
METRIC RATING
263rd/ 347
METRIC RANK
$53,359
PER CAPITA INCOME
100.0/ 100
METRIC RATING
25th/ 347
METRIC RANK
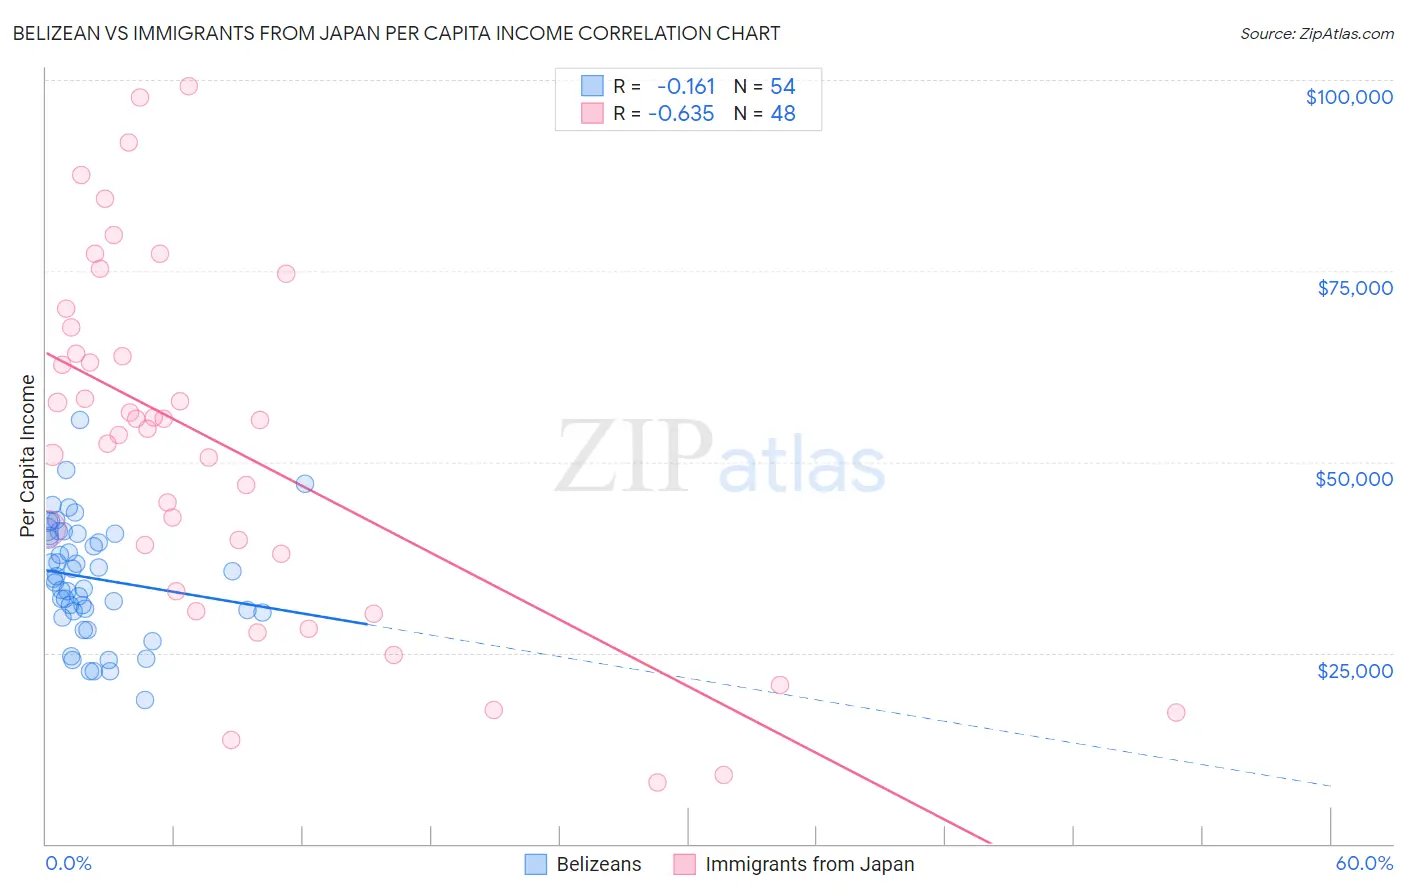
Belizean vs Immigrants from Japan Per Capita Income Correlation Chart
The statistical analysis conducted on geographies consisting of 144,225,006 people shows a poor negative correlation between the proportion of Belizeans and per capita income in the United States with a correlation coefficient (R) of -0.161 and weighted average of $39,097. Similarly, the statistical analysis conducted on geographies consisting of 340,161,368 people shows a significant negative correlation between the proportion of Immigrants from Japan and per capita income in the United States with a correlation coefficient (R) of -0.635 and weighted average of $53,359, a difference of 36.5%.
Per Capita Income Correlation Summary
| Measurement | Belizean | Immigrants from Japan |
| Minimum | $18,752 | $8,097 |
| Maximum | $55,551 | $99,130 |
| Range | $36,799 | $91,033 |
| Mean | $34,798 | $52,166 |
| Median | $34,873 | $54,914 |
| Interquartile 25% (IQ1) | $30,514 | $35,570 |
| Interquartile 75% (IQ3) | $40,555 | $65,919 |
| Interquartile Range (IQR) | $10,041 | $30,349 |
| Standard Deviation (Sample) | $7,514 | $23,163 |
| Standard Deviation (Population) | $7,444 | $22,920 |
Similar Demographics by Per Capita Income
Demographics Similar to Belizeans by Per Capita Income
In terms of per capita income, the demographic groups most similar to Belizeans are Iroquois ($39,104, a difference of 0.020%), Marshallese ($39,108, a difference of 0.030%), American ($39,039, a difference of 0.15%), Alaskan Athabascan ($39,163, a difference of 0.17%), and Spanish American ($39,012, a difference of 0.22%).
| Demographics | Rating | Rank | Per Capita Income |
| Hawaiians | 0.8 /100 | #256 | Tragic $39,403 |
| Nicaraguans | 0.8 /100 | #257 | Tragic $39,372 |
| Jamaicans | 0.7 /100 | #258 | Tragic $39,231 |
| Malaysians | 0.7 /100 | #259 | Tragic $39,194 |
| Alaskan Athabascans | 0.6 /100 | #260 | Tragic $39,163 |
| Marshallese | 0.6 /100 | #261 | Tragic $39,108 |
| Iroquois | 0.6 /100 | #262 | Tragic $39,104 |
| Belizeans | 0.6 /100 | #263 | Tragic $39,097 |
| Americans | 0.6 /100 | #264 | Tragic $39,039 |
| Spanish Americans | 0.5 /100 | #265 | Tragic $39,012 |
| Salvadorans | 0.5 /100 | #266 | Tragic $38,858 |
| Immigrants | Zaire | 0.4 /100 | #267 | Tragic $38,848 |
| Liberians | 0.4 /100 | #268 | Tragic $38,780 |
| Immigrants | Jamaica | 0.4 /100 | #269 | Tragic $38,766 |
| Immigrants | Belize | 0.3 /100 | #270 | Tragic $38,614 |
Demographics Similar to Immigrants from Japan by Per Capita Income
In terms of per capita income, the demographic groups most similar to Immigrants from Japan are Russian ($53,154, a difference of 0.39%), Immigrants from Denmark ($53,799, a difference of 0.82%), Immigrants from Eastern Asia ($53,806, a difference of 0.84%), Indian (Asian) ($53,874, a difference of 0.97%), and Immigrants from South Central Asia ($52,660, a difference of 1.3%).
| Demographics | Rating | Rank | Per Capita Income |
| Thais | 100.0 /100 | #18 | Exceptional $54,307 |
| Immigrants | China | 100.0 /100 | #19 | Exceptional $54,264 |
| Soviet Union | 100.0 /100 | #20 | Exceptional $54,202 |
| Immigrants | Northern Europe | 100.0 /100 | #21 | Exceptional $54,159 |
| Indians (Asian) | 100.0 /100 | #22 | Exceptional $53,874 |
| Immigrants | Eastern Asia | 100.0 /100 | #23 | Exceptional $53,806 |
| Immigrants | Denmark | 100.0 /100 | #24 | Exceptional $53,799 |
| Immigrants | Japan | 100.0 /100 | #25 | Exceptional $53,359 |
| Russians | 100.0 /100 | #26 | Exceptional $53,154 |
| Immigrants | South Central Asia | 100.0 /100 | #27 | Exceptional $52,660 |
| Latvians | 100.0 /100 | #28 | Exceptional $52,649 |
| Israelis | 100.0 /100 | #29 | Exceptional $52,596 |
| Immigrants | Austria | 100.0 /100 | #30 | Exceptional $52,503 |
| Turks | 100.0 /100 | #31 | Exceptional $52,391 |
| Immigrants | Norway | 100.0 /100 | #32 | Exceptional $52,217 |