Belizean vs Immigrants from Japan In Labor Force | Age > 16
COMPARE
Belizean
Immigrants from Japan
In Labor Force | Age > 16
In Labor Force | Age > 16 Comparison
Belizeans
Immigrants from Japan
64.8%
IN LABOR FORCE | AGE > 16
16.2/ 100
METRIC RATING
208th/ 347
METRIC RANK
65.8%
IN LABOR FORCE | AGE > 16
98.0/ 100
METRIC RATING
109th/ 347
METRIC RANK
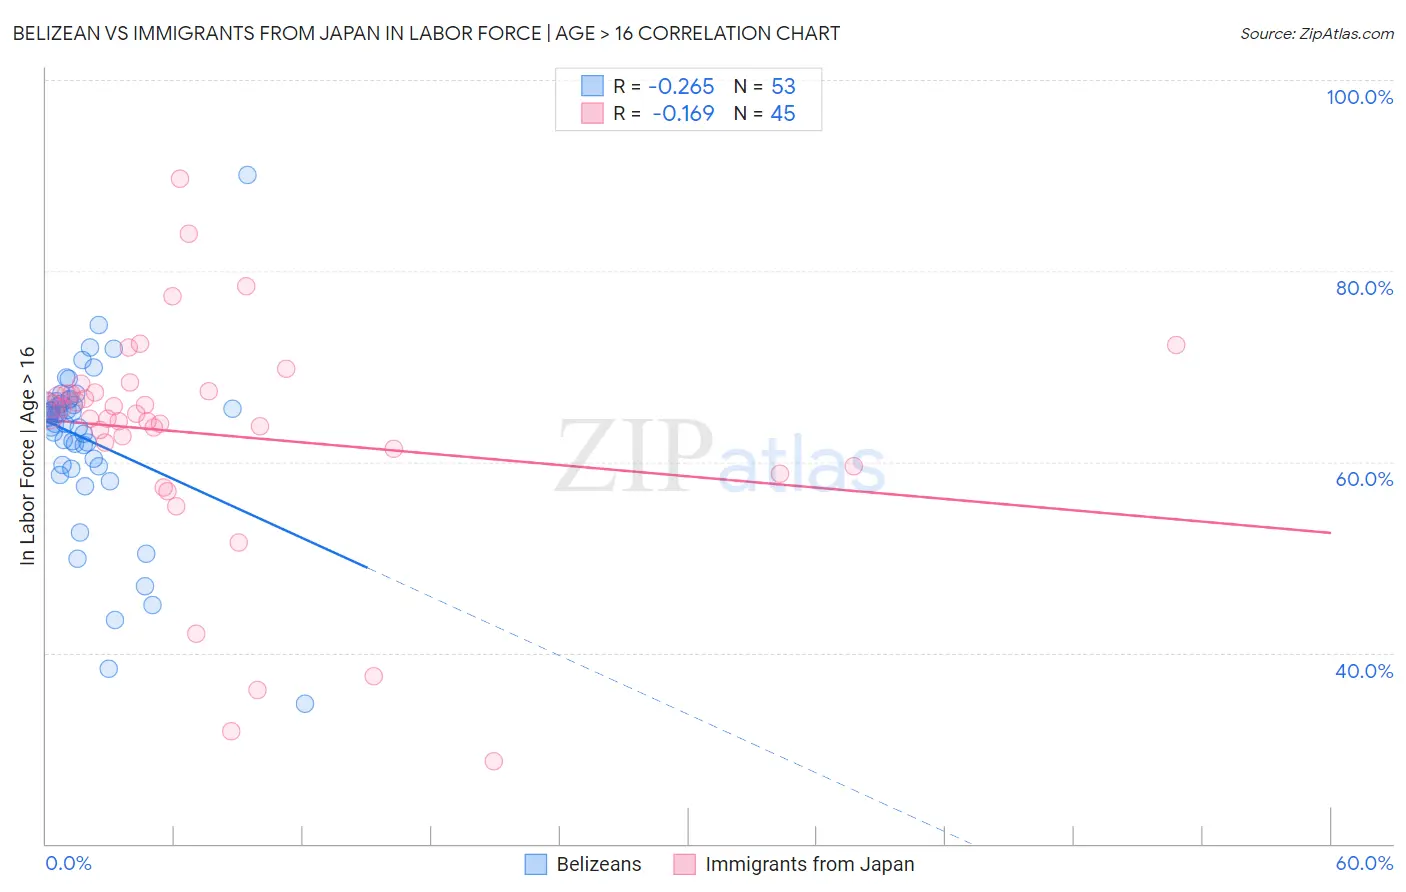
Belizean vs Immigrants from Japan In Labor Force | Age > 16 Correlation Chart
The statistical analysis conducted on geographies consisting of 144,214,233 people shows a weak negative correlation between the proportion of Belizeans and labor force participation rate among population ages 16 and over in the United States with a correlation coefficient (R) of -0.265 and weighted average of 64.8%. Similarly, the statistical analysis conducted on geographies consisting of 340,160,245 people shows a poor negative correlation between the proportion of Immigrants from Japan and labor force participation rate among population ages 16 and over in the United States with a correlation coefficient (R) of -0.169 and weighted average of 65.8%, a difference of 1.6%.
In Labor Force | Age > 16 Correlation Summary
| Measurement | Belizean | Immigrants from Japan |
| Minimum | 34.7% | 28.6% |
| Maximum | 90.0% | 89.6% |
| Range | 55.3% | 61.0% |
| Mean | 62.3% | 62.9% |
| Median | 64.7% | 65.1% |
| Interquartile 25% (IQ1) | 59.6% | 60.5% |
| Interquartile 75% (IQ3) | 66.2% | 67.3% |
| Interquartile Range (IQR) | 6.6% | 6.8% |
| Standard Deviation (Sample) | 9.1% | 12.0% |
| Standard Deviation (Population) | 9.0% | 11.9% |
Similar Demographics by In Labor Force | Age > 16
Demographics Similar to Belizeans by In Labor Force | Age > 16
In terms of in labor force | age > 16, the demographic groups most similar to Belizeans are Immigrants from Latin America (64.8%, a difference of 0.010%), Immigrants from Trinidad and Tobago (64.8%, a difference of 0.010%), Lithuanian (64.8%, a difference of 0.020%), Immigrants from Denmark (64.8%, a difference of 0.030%), and Fijian (64.8%, a difference of 0.040%).
| Demographics | Rating | Rank | In Labor Force | Age > 16 |
| Ukrainians | 19.6 /100 | #201 | Poor 64.9% |
| Immigrants | Belgium | 19.4 /100 | #202 | Poor 64.9% |
| Russians | 18.8 /100 | #203 | Poor 64.9% |
| Slovenes | 18.7 /100 | #204 | Poor 64.9% |
| Jamaicans | 18.7 /100 | #205 | Poor 64.9% |
| Lithuanians | 17.4 /100 | #206 | Poor 64.8% |
| Immigrants | Latin America | 16.4 /100 | #207 | Poor 64.8% |
| Belizeans | 16.2 /100 | #208 | Poor 64.8% |
| Immigrants | Trinidad and Tobago | 15.6 /100 | #209 | Poor 64.8% |
| Immigrants | Denmark | 14.7 /100 | #210 | Poor 64.8% |
| Fijians | 14.1 /100 | #211 | Poor 64.8% |
| Alaskan Athabascans | 13.9 /100 | #212 | Poor 64.8% |
| Maltese | 13.8 /100 | #213 | Poor 64.8% |
| Estonians | 13.1 /100 | #214 | Poor 64.8% |
| Immigrants | Czechoslovakia | 12.3 /100 | #215 | Poor 64.8% |
Demographics Similar to Immigrants from Japan by In Labor Force | Age > 16
In terms of in labor force | age > 16, the demographic groups most similar to Immigrants from Japan are Immigrants from Spain (65.8%, a difference of 0.0%), Immigrants from Serbia (65.8%, a difference of 0.020%), Immigrants from Poland (65.8%, a difference of 0.020%), Japanese (65.8%, a difference of 0.040%), and Colombian (65.9%, a difference of 0.060%).
| Demographics | Rating | Rank | In Labor Force | Age > 16 |
| Uruguayans | 98.6 /100 | #102 | Exceptional 65.9% |
| Immigrants | South Eastern Asia | 98.5 /100 | #103 | Exceptional 65.9% |
| Palestinians | 98.5 /100 | #104 | Exceptional 65.9% |
| Colombians | 98.4 /100 | #105 | Exceptional 65.9% |
| Immigrants | Serbia | 98.1 /100 | #106 | Exceptional 65.8% |
| Immigrants | Poland | 98.1 /100 | #107 | Exceptional 65.8% |
| Immigrants | Spain | 98.0 /100 | #108 | Exceptional 65.8% |
| Immigrants | Japan | 98.0 /100 | #109 | Exceptional 65.8% |
| Japanese | 97.7 /100 | #110 | Exceptional 65.8% |
| Immigrants | Honduras | 97.5 /100 | #111 | Exceptional 65.8% |
| Laotians | 97.4 /100 | #112 | Exceptional 65.8% |
| Pakistanis | 97.1 /100 | #113 | Exceptional 65.8% |
| Hondurans | 97.1 /100 | #114 | Exceptional 65.8% |
| Immigrants | Indonesia | 96.8 /100 | #115 | Exceptional 65.7% |
| Argentineans | 96.7 /100 | #116 | Exceptional 65.7% |