Basque vs Spanish American 7th Grade
COMPARE
Basque
Spanish American
7th Grade
7th Grade Comparison
Basques
Spanish Americans
96.4%
7TH GRADE
89.3/ 100
METRIC RATING
139th/ 347
METRIC RANK
95.7%
7TH GRADE
9.3/ 100
METRIC RATING
215th/ 347
METRIC RANK
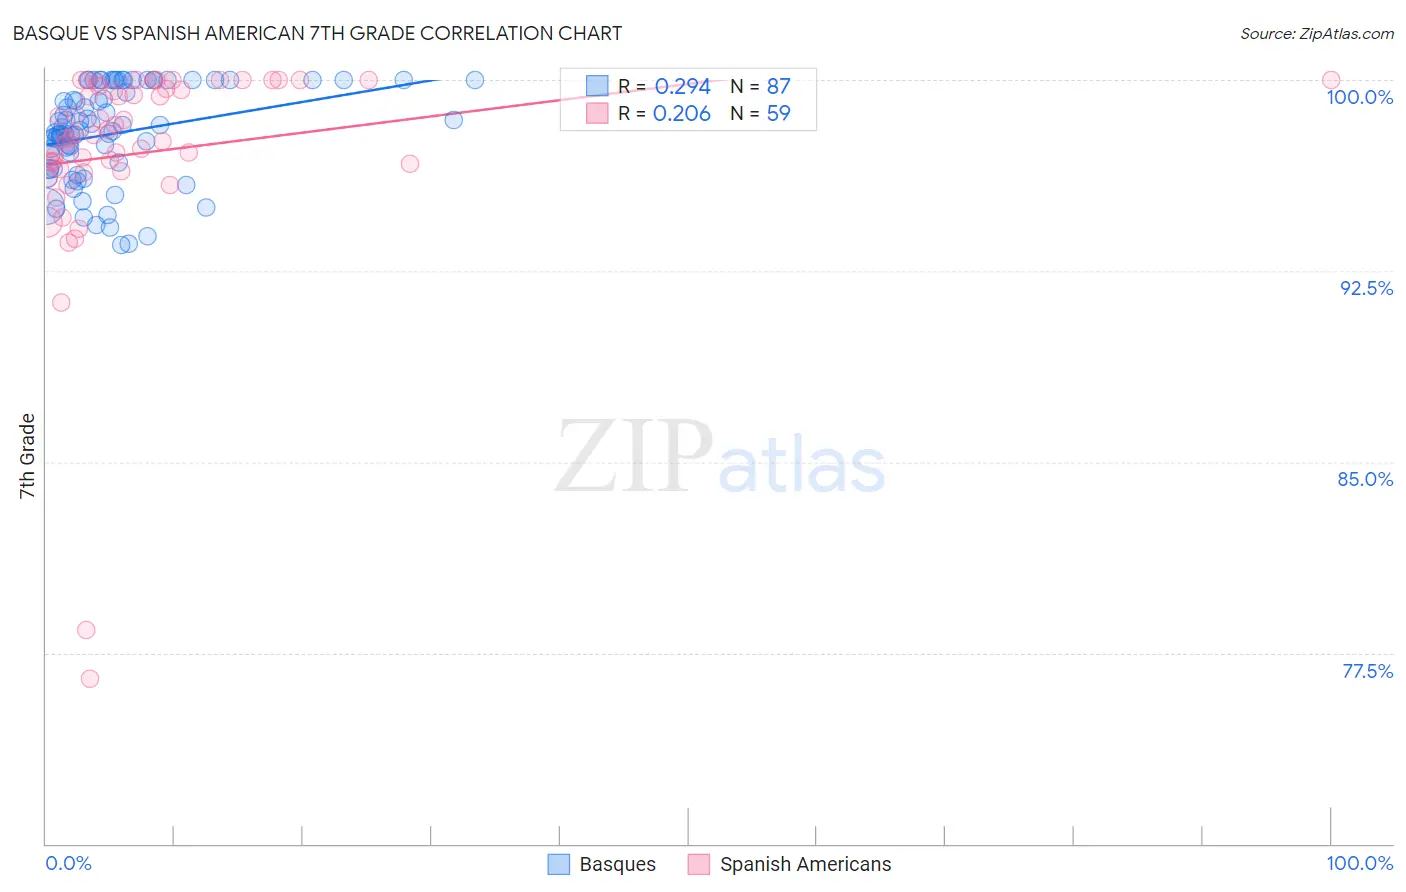
Basque vs Spanish American 7th Grade Correlation Chart
The statistical analysis conducted on geographies consisting of 165,777,136 people shows a weak positive correlation between the proportion of Basques and percentage of population with at least 7th grade education in the United States with a correlation coefficient (R) of 0.294 and weighted average of 96.4%. Similarly, the statistical analysis conducted on geographies consisting of 103,168,542 people shows a weak positive correlation between the proportion of Spanish Americans and percentage of population with at least 7th grade education in the United States with a correlation coefficient (R) of 0.206 and weighted average of 95.7%, a difference of 0.68%.
7th Grade Correlation Summary
| Measurement | Basque | Spanish American |
| Minimum | 93.5% | 76.5% |
| Maximum | 100.0% | 100.0% |
| Range | 6.5% | 23.5% |
| Mean | 97.9% | 97.1% |
| Median | 98.0% | 97.8% |
| Interquartile 25% (IQ1) | 96.5% | 96.5% |
| Interquartile 75% (IQ3) | 100.0% | 99.8% |
| Interquartile Range (IQR) | 3.5% | 3.2% |
| Standard Deviation (Sample) | 1.8% | 4.2% |
| Standard Deviation (Population) | 1.8% | 4.2% |
Similar Demographics by 7th Grade
Demographics Similar to Basques by 7th Grade
In terms of 7th grade, the demographic groups most similar to Basques are Jordanian (96.4%, a difference of 0.010%), Immigrants from Hungary (96.4%, a difference of 0.020%), Immigrants from Turkey (96.4%, a difference of 0.020%), Cambodian (96.3%, a difference of 0.020%), and Soviet Union (96.4%, a difference of 0.030%).
| Demographics | Rating | Rank | 7th Grade |
| Colville | 91.7 /100 | #132 | Exceptional 96.4% |
| Hmong | 91.5 /100 | #133 | Exceptional 96.4% |
| Soviet Union | 91.2 /100 | #134 | Exceptional 96.4% |
| Immigrants | Kuwait | 91.1 /100 | #135 | Exceptional 96.4% |
| Immigrants | Hungary | 90.6 /100 | #136 | Exceptional 96.4% |
| Immigrants | Turkey | 90.2 /100 | #137 | Exceptional 96.4% |
| Jordanians | 90.0 /100 | #138 | Excellent 96.4% |
| Basques | 89.3 /100 | #139 | Excellent 96.4% |
| Cambodians | 88.3 /100 | #140 | Excellent 96.3% |
| Immigrants | South Central Asia | 87.1 /100 | #141 | Excellent 96.3% |
| Burmese | 87.1 /100 | #142 | Excellent 96.3% |
| Spanish | 86.6 /100 | #143 | Excellent 96.3% |
| Immigrants | Greece | 85.9 /100 | #144 | Excellent 96.3% |
| Blackfeet | 83.9 /100 | #145 | Excellent 96.3% |
| Immigrants | Eastern Europe | 83.7 /100 | #146 | Excellent 96.3% |
Demographics Similar to Spanish Americans by 7th Grade
In terms of 7th grade, the demographic groups most similar to Spanish Americans are Immigrants from Chile (95.7%, a difference of 0.0%), Immigrants from Pakistan (95.7%, a difference of 0.010%), Immigrants from Liberia (95.7%, a difference of 0.020%), Immigrants from Southern Europe (95.7%, a difference of 0.030%), and Bahamian (95.7%, a difference of 0.040%).
| Demographics | Rating | Rank | 7th Grade |
| Immigrants | Sudan | 17.0 /100 | #208 | Poor 95.8% |
| Dutch West Indians | 16.1 /100 | #209 | Poor 95.8% |
| Hawaiians | 16.0 /100 | #210 | Poor 95.8% |
| Portuguese | 13.6 /100 | #211 | Poor 95.8% |
| Immigrants | Lebanon | 13.0 /100 | #212 | Poor 95.8% |
| Immigrants | Morocco | 12.6 /100 | #213 | Poor 95.8% |
| Bahamians | 11.6 /100 | #214 | Poor 95.7% |
| Spanish Americans | 9.3 /100 | #215 | Tragic 95.7% |
| Immigrants | Chile | 9.1 /100 | #216 | Tragic 95.7% |
| Immigrants | Pakistan | 9.0 /100 | #217 | Tragic 95.7% |
| Immigrants | Liberia | 8.1 /100 | #218 | Tragic 95.7% |
| Immigrants | Southern Europe | 7.9 /100 | #219 | Tragic 95.7% |
| Sub-Saharan Africans | 7.2 /100 | #220 | Tragic 95.7% |
| Samoans | 7.0 /100 | #221 | Tragic 95.7% |
| Laotians | 6.8 /100 | #222 | Tragic 95.7% |