Bangladeshi vs French Per Capita Income
COMPARE
Bangladeshi
French
Per Capita Income
Per Capita Income Comparison
Bangladeshis
French
$35,897
PER CAPITA INCOME
0.0/ 100
METRIC RATING
318th/ 347
METRIC RANK
$43,685
PER CAPITA INCOME
50.7/ 100
METRIC RATING
173rd/ 347
METRIC RANK
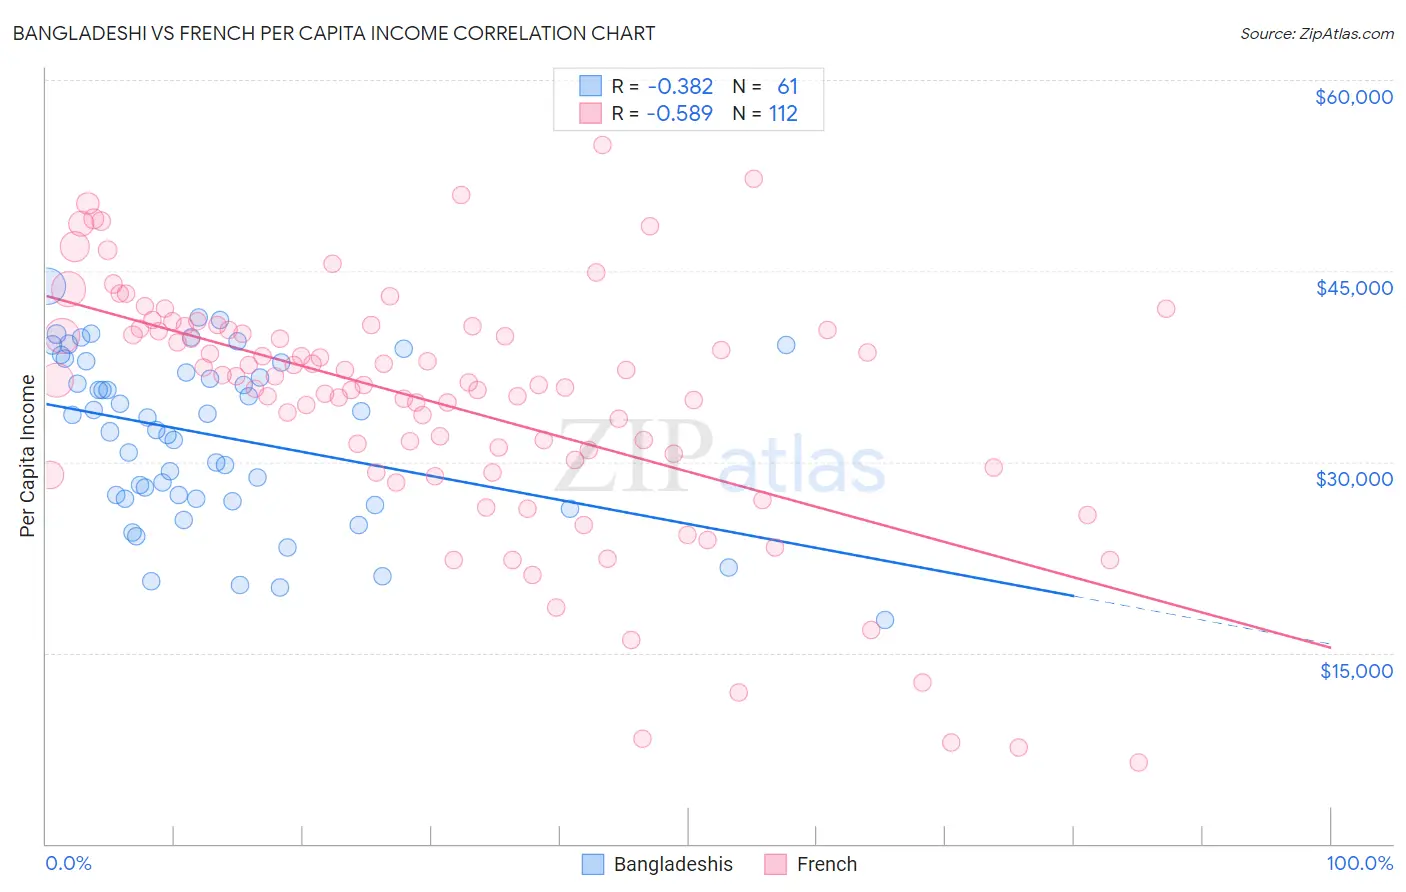
Bangladeshi vs French Per Capita Income Correlation Chart
The statistical analysis conducted on geographies consisting of 141,454,199 people shows a mild negative correlation between the proportion of Bangladeshis and per capita income in the United States with a correlation coefficient (R) of -0.382 and weighted average of $35,897. Similarly, the statistical analysis conducted on geographies consisting of 572,484,193 people shows a substantial negative correlation between the proportion of French and per capita income in the United States with a correlation coefficient (R) of -0.589 and weighted average of $43,685, a difference of 21.7%.
Per Capita Income Correlation Summary
| Measurement | Bangladeshi | French |
| Minimum | $17,577 | $6,335 |
| Maximum | $43,772 | $54,853 |
| Range | $26,195 | $48,518 |
| Mean | $32,070 | $34,598 |
| Median | $33,478 | $36,348 |
| Interquartile 25% (IQ1) | $27,131 | $29,890 |
| Interquartile 75% (IQ3) | $37,833 | $40,437 |
| Interquartile Range (IQR) | $10,702 | $10,547 |
| Standard Deviation (Sample) | $6,476 | $9,750 |
| Standard Deviation (Population) | $6,423 | $9,706 |
Similar Demographics by Per Capita Income
Demographics Similar to Bangladeshis by Per Capita Income
In terms of per capita income, the demographic groups most similar to Bangladeshis are Dutch West Indian ($35,922, a difference of 0.070%), Choctaw ($35,999, a difference of 0.28%), Immigrants from Congo ($35,720, a difference of 0.50%), Hispanic or Latino ($35,688, a difference of 0.59%), and Yaqui ($36,112, a difference of 0.60%).
| Demographics | Rating | Rank | Per Capita Income |
| Chippewa | 0.0 /100 | #311 | Tragic $36,631 |
| Chickasaw | 0.0 /100 | #312 | Tragic $36,475 |
| Bahamians | 0.0 /100 | #313 | Tragic $36,427 |
| Seminole | 0.0 /100 | #314 | Tragic $36,180 |
| Yaqui | 0.0 /100 | #315 | Tragic $36,112 |
| Choctaw | 0.0 /100 | #316 | Tragic $35,999 |
| Dutch West Indians | 0.0 /100 | #317 | Tragic $35,922 |
| Bangladeshis | 0.0 /100 | #318 | Tragic $35,897 |
| Immigrants | Congo | 0.0 /100 | #319 | Tragic $35,720 |
| Hispanics or Latinos | 0.0 /100 | #320 | Tragic $35,688 |
| Blacks/African Americans | 0.0 /100 | #321 | Tragic $35,564 |
| Creek | 0.0 /100 | #322 | Tragic $35,546 |
| Cheyenne | 0.0 /100 | #323 | Tragic $35,276 |
| Kiowa | 0.0 /100 | #324 | Tragic $35,102 |
| Immigrants | Central America | 0.0 /100 | #325 | Tragic $34,974 |
Demographics Similar to French by Per Capita Income
In terms of per capita income, the demographic groups most similar to French are Colombian ($43,661, a difference of 0.060%), Celtic ($43,621, a difference of 0.15%), Czechoslovakian ($43,806, a difference of 0.28%), Immigrants from South Eastern Asia ($43,539, a difference of 0.34%), and Immigrants from Eastern Africa ($43,838, a difference of 0.35%).
| Demographics | Rating | Rank | Per Capita Income |
| Immigrants | Uruguay | 59.3 /100 | #166 | Average $43,997 |
| English | 58.9 /100 | #167 | Average $43,982 |
| Belgians | 58.1 /100 | #168 | Average $43,951 |
| Immigrants | Peru | 55.3 /100 | #169 | Average $43,852 |
| Scandinavians | 55.2 /100 | #170 | Average $43,848 |
| Immigrants | Eastern Africa | 54.9 /100 | #171 | Average $43,838 |
| Czechoslovakians | 54.1 /100 | #172 | Average $43,806 |
| French | 50.7 /100 | #173 | Average $43,685 |
| Colombians | 50.0 /100 | #174 | Average $43,661 |
| Celtics | 48.9 /100 | #175 | Average $43,621 |
| Immigrants | South Eastern Asia | 46.6 /100 | #176 | Average $43,539 |
| Tlingit-Haida | 45.9 /100 | #177 | Average $43,516 |
| Immigrants | Costa Rica | 44.5 /100 | #178 | Average $43,464 |
| Finns | 44.4 /100 | #179 | Average $43,461 |
| Sierra Leoneans | 42.9 /100 | #180 | Average $43,405 |