Bangladeshi vs Guatemalan Median Earnings
COMPARE
Bangladeshi
Guatemalan
Median Earnings
Median Earnings Comparison
Bangladeshis
Guatemalans
$41,263
MEDIAN EARNINGS
0.1/ 100
METRIC RATING
295th/ 347
METRIC RANK
$41,205
MEDIAN EARNINGS
0.1/ 100
METRIC RATING
297th/ 347
METRIC RANK
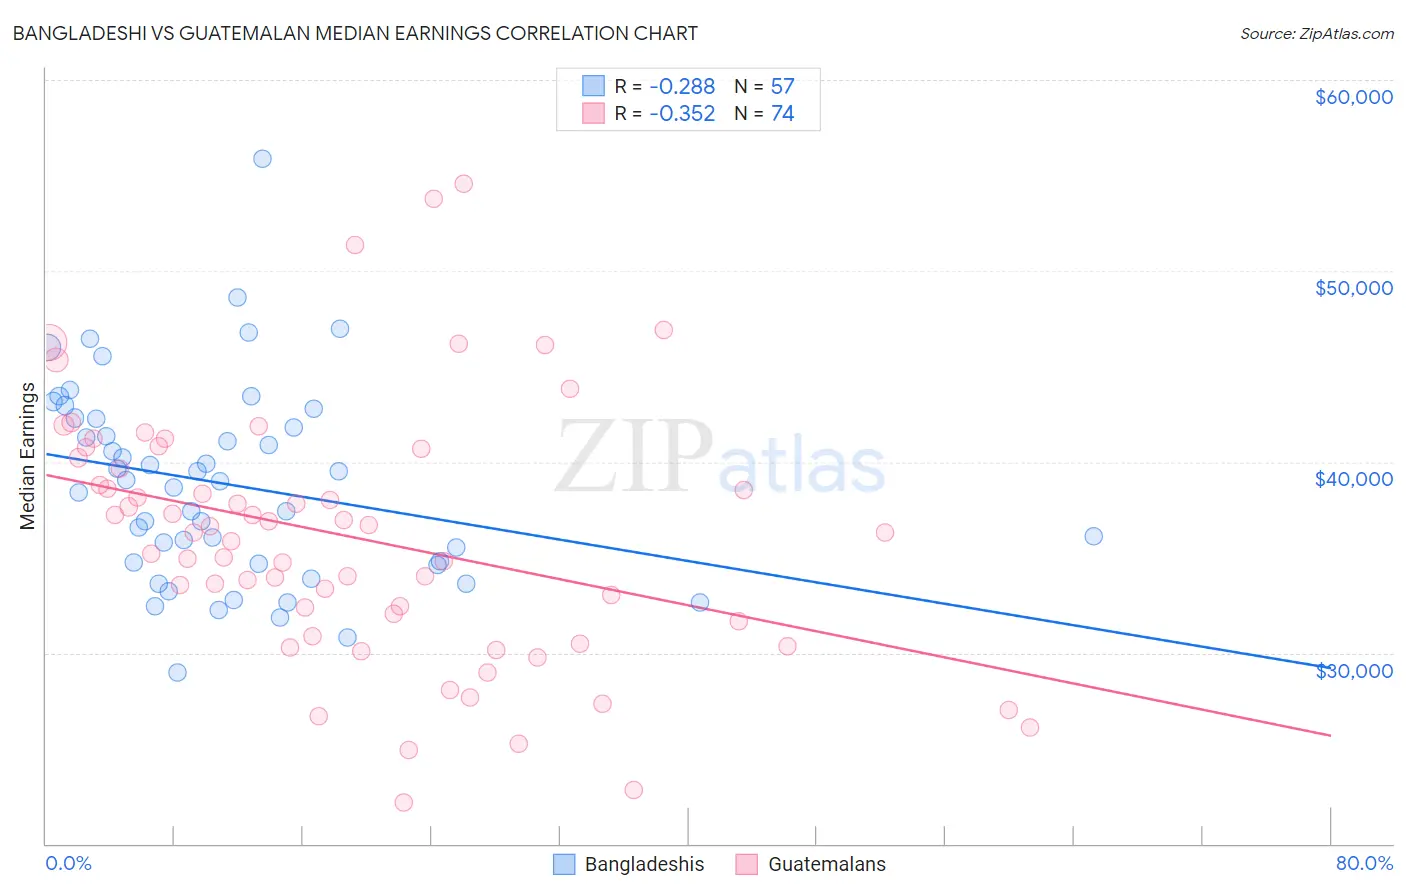
Bangladeshi vs Guatemalan Median Earnings Correlation Chart
The statistical analysis conducted on geographies consisting of 141,452,923 people shows a weak negative correlation between the proportion of Bangladeshis and median earnings in the United States with a correlation coefficient (R) of -0.288 and weighted average of $41,263. Similarly, the statistical analysis conducted on geographies consisting of 409,559,083 people shows a mild negative correlation between the proportion of Guatemalans and median earnings in the United States with a correlation coefficient (R) of -0.352 and weighted average of $41,205, a difference of 0.14%.
Median Earnings Correlation Summary
| Measurement | Bangladeshi | Guatemalan |
| Minimum | $28,992 | $22,174 |
| Maximum | $55,893 | $54,583 |
| Range | $26,901 | $32,409 |
| Mean | $38,826 | $36,063 |
| Median | $38,964 | $36,315 |
| Interquartile 25% (IQ1) | $34,688 | $31,673 |
| Interquartile 75% (IQ3) | $42,288 | $40,213 |
| Interquartile Range (IQR) | $7,600 | $8,540 |
| Standard Deviation (Sample) | $5,171 | $6,708 |
| Standard Deviation (Population) | $5,125 | $6,663 |
Demographics Similar to Bangladeshis and Guatemalans by Median Earnings
In terms of median earnings, the demographic groups most similar to Bangladeshis are Cherokee ($41,252, a difference of 0.030%), Potawatomi ($41,288, a difference of 0.060%), Immigrants from Zaire ($41,325, a difference of 0.15%), Immigrants from Micronesia ($41,133, a difference of 0.32%), and Immigrants from Caribbean ($41,119, a difference of 0.35%). Similarly, the demographic groups most similar to Guatemalans are Cherokee ($41,252, a difference of 0.11%), Immigrants from Micronesia ($41,133, a difference of 0.17%), Potawatomi ($41,288, a difference of 0.20%), Immigrants from Caribbean ($41,119, a difference of 0.21%), and Immigrants from Zaire ($41,325, a difference of 0.29%).
| Demographics | Rating | Rank | Median Earnings |
| Mexican American Indians | 0.1 /100 | #286 | Tragic $41,719 |
| Indonesians | 0.1 /100 | #287 | Tragic $41,701 |
| Immigrants | Dominican Republic | 0.1 /100 | #288 | Tragic $41,554 |
| Comanche | 0.1 /100 | #289 | Tragic $41,519 |
| Paiute | 0.1 /100 | #290 | Tragic $41,508 |
| Central American Indians | 0.1 /100 | #291 | Tragic $41,474 |
| U.S. Virgin Islanders | 0.1 /100 | #292 | Tragic $41,448 |
| Immigrants | Zaire | 0.1 /100 | #293 | Tragic $41,325 |
| Potawatomi | 0.1 /100 | #294 | Tragic $41,288 |
| Bangladeshis | 0.1 /100 | #295 | Tragic $41,263 |
| Cherokee | 0.1 /100 | #296 | Tragic $41,252 |
| Guatemalans | 0.1 /100 | #297 | Tragic $41,205 |
| Immigrants | Micronesia | 0.1 /100 | #298 | Tragic $41,133 |
| Immigrants | Caribbean | 0.1 /100 | #299 | Tragic $41,119 |
| Ute | 0.1 /100 | #300 | Tragic $41,051 |
| Immigrants | Latin America | 0.1 /100 | #301 | Tragic $41,049 |
| Shoshone | 0.0 /100 | #302 | Tragic $40,932 |
| Haitians | 0.0 /100 | #303 | Tragic $40,918 |
| Immigrants | Guatemala | 0.0 /100 | #304 | Tragic $40,851 |
| Chickasaw | 0.0 /100 | #305 | Tragic $40,672 |
| Yaqui | 0.0 /100 | #306 | Tragic $40,647 |