Immigrants from Afghanistan vs Immigrants from Norway Median Household Income
COMPARE
Immigrants from Afghanistan
Immigrants from Norway
Median Household Income
Median Household Income Comparison
Immigrants from Afghanistan
Immigrants from Norway
$93,375
MEDIAN HOUSEHOLD INCOME
99.5/ 100
METRIC RATING
77th/ 347
METRIC RANK
$94,846
MEDIAN HOUSEHOLD INCOME
99.8/ 100
METRIC RATING
62nd/ 347
METRIC RANK
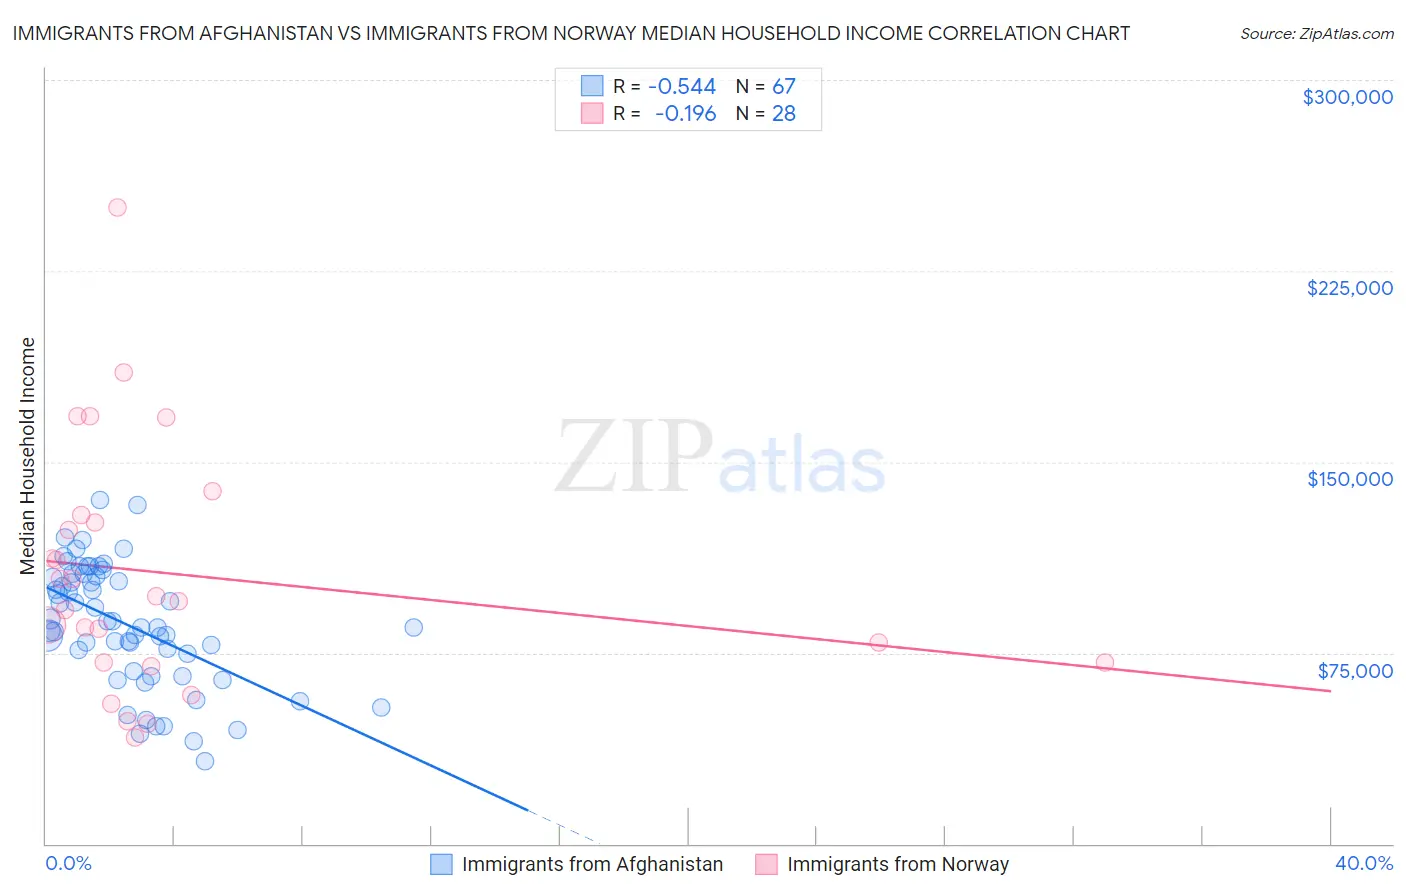
Immigrants from Afghanistan vs Immigrants from Norway Median Household Income Correlation Chart
The statistical analysis conducted on geographies consisting of 147,635,708 people shows a substantial negative correlation between the proportion of Immigrants from Afghanistan and median household income in the United States with a correlation coefficient (R) of -0.544 and weighted average of $93,375. Similarly, the statistical analysis conducted on geographies consisting of 116,683,199 people shows a poor negative correlation between the proportion of Immigrants from Norway and median household income in the United States with a correlation coefficient (R) of -0.196 and weighted average of $94,846, a difference of 1.6%.
Median Household Income Correlation Summary
| Measurement | Immigrants from Afghanistan | Immigrants from Norway |
| Minimum | $32,569 | $41,875 |
| Maximum | $134,953 | $250,001 |
| Range | $102,384 | $208,126 |
| Mean | $86,066 | $106,024 |
| Median | $85,055 | $96,218 |
| Interquartile 25% (IQ1) | $67,813 | $71,155 |
| Interquartile 75% (IQ3) | $105,164 | $127,785 |
| Interquartile Range (IQR) | $37,351 | $56,630 |
| Standard Deviation (Sample) | $23,740 | $48,243 |
| Standard Deviation (Population) | $23,562 | $47,374 |
Demographics Similar to Immigrants from Afghanistan and Immigrants from Norway by Median Household Income
In terms of median household income, the demographic groups most similar to Immigrants from Afghanistan are South African ($93,379, a difference of 0.0%), Immigrants from Italy ($93,465, a difference of 0.10%), Immigrants from Latvia ($93,602, a difference of 0.24%), Immigrants from Bulgaria ($93,148, a difference of 0.24%), and Sri Lankan ($93,093, a difference of 0.30%). Similarly, the demographic groups most similar to Immigrants from Norway are Greek ($94,735, a difference of 0.12%), Laotian ($94,990, a difference of 0.15%), Korean ($95,018, a difference of 0.18%), Immigrants from Europe ($95,032, a difference of 0.20%), and Immigrants from Netherlands ($94,411, a difference of 0.46%).
| Demographics | Rating | Rank | Median Household Income |
| Immigrants | Europe | 99.8 /100 | #59 | Exceptional $95,032 |
| Koreans | 99.8 /100 | #60 | Exceptional $95,018 |
| Laotians | 99.8 /100 | #61 | Exceptional $94,990 |
| Immigrants | Norway | 99.8 /100 | #62 | Exceptional $94,846 |
| Greeks | 99.8 /100 | #63 | Exceptional $94,735 |
| Immigrants | Netherlands | 99.7 /100 | #64 | Exceptional $94,411 |
| Immigrants | Belarus | 99.7 /100 | #65 | Exceptional $94,399 |
| Immigrants | Romania | 99.7 /100 | #66 | Exceptional $94,222 |
| Immigrants | Scotland | 99.7 /100 | #67 | Exceptional $94,091 |
| Mongolians | 99.7 /100 | #68 | Exceptional $93,971 |
| Argentineans | 99.7 /100 | #69 | Exceptional $93,960 |
| Immigrants | Fiji | 99.7 /100 | #70 | Exceptional $93,933 |
| Immigrants | Philippines | 99.6 /100 | #71 | Exceptional $93,899 |
| Lithuanians | 99.6 /100 | #72 | Exceptional $93,852 |
| Immigrants | Egypt | 99.6 /100 | #73 | Exceptional $93,700 |
| Immigrants | Latvia | 99.6 /100 | #74 | Exceptional $93,602 |
| Immigrants | Italy | 99.5 /100 | #75 | Exceptional $93,465 |
| South Africans | 99.5 /100 | #76 | Exceptional $93,379 |
| Immigrants | Afghanistan | 99.5 /100 | #77 | Exceptional $93,375 |
| Immigrants | Bulgaria | 99.4 /100 | #78 | Exceptional $93,148 |
| Sri Lankans | 99.4 /100 | #79 | Exceptional $93,093 |