Immigrants from Honduras vs Immigrants from Fiji Median Earnings
COMPARE
Immigrants from Honduras
Immigrants from Fiji
Median Earnings
Median Earnings Comparison
Immigrants from Honduras
Immigrants from Fiji
$40,195
MEDIAN EARNINGS
0.0/ 100
METRIC RATING
316th/ 347
METRIC RANK
$48,305
MEDIAN EARNINGS
93.3/ 100
METRIC RATING
125th/ 347
METRIC RANK
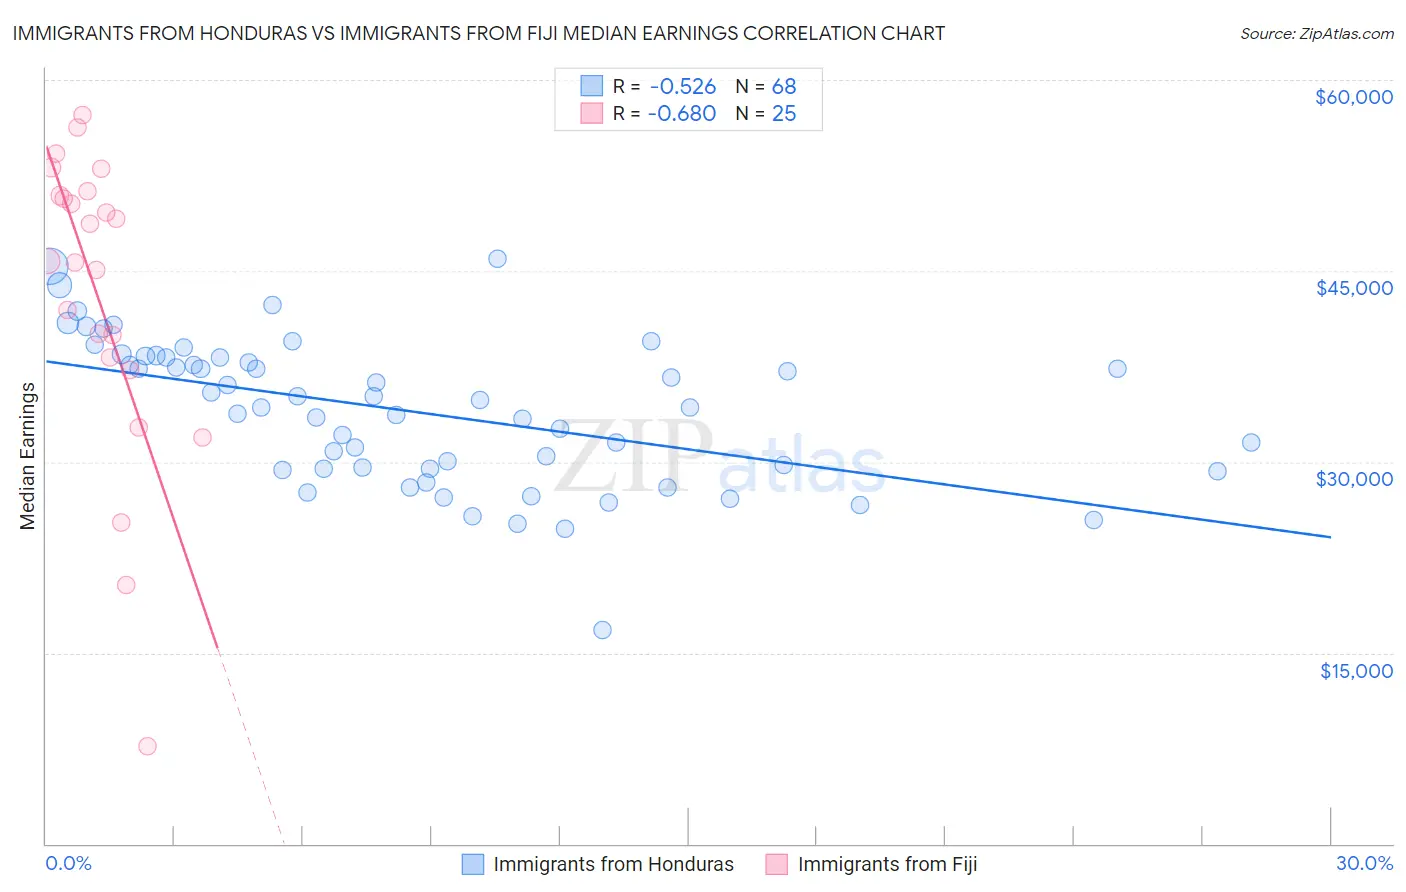
Immigrants from Honduras vs Immigrants from Fiji Median Earnings Correlation Chart
The statistical analysis conducted on geographies consisting of 322,602,999 people shows a substantial negative correlation between the proportion of Immigrants from Honduras and median earnings in the United States with a correlation coefficient (R) of -0.526 and weighted average of $40,195. Similarly, the statistical analysis conducted on geographies consisting of 93,756,016 people shows a significant negative correlation between the proportion of Immigrants from Fiji and median earnings in the United States with a correlation coefficient (R) of -0.680 and weighted average of $48,305, a difference of 20.2%.
Median Earnings Correlation Summary
| Measurement | Immigrants from Honduras | Immigrants from Fiji |
| Minimum | $16,824 | $7,703 |
| Maximum | $45,968 | $57,229 |
| Range | $29,144 | $49,526 |
| Mean | $34,003 | $43,044 |
| Median | $34,587 | $45,776 |
| Interquartile 25% (IQ1) | $29,475 | $37,711 |
| Interquartile 75% (IQ3) | $38,232 | $51,118 |
| Interquartile Range (IQR) | $8,757 | $13,407 |
| Standard Deviation (Sample) | $5,716 | $12,014 |
| Standard Deviation (Population) | $5,674 | $11,772 |
Similar Demographics by Median Earnings
Demographics Similar to Immigrants from Honduras by Median Earnings
In terms of median earnings, the demographic groups most similar to Immigrants from Honduras are Fijian ($40,193, a difference of 0.0%), Seminole ($40,233, a difference of 0.090%), Cheyenne ($40,233, a difference of 0.10%), Choctaw ($40,270, a difference of 0.19%), and Dutch West Indian ($40,107, a difference of 0.22%).
| Demographics | Rating | Rank | Median Earnings |
| Immigrants | Haiti | 0.0 /100 | #309 | Tragic $40,550 |
| Apache | 0.0 /100 | #310 | Tragic $40,388 |
| Hispanics or Latinos | 0.0 /100 | #311 | Tragic $40,288 |
| Chippewa | 0.0 /100 | #312 | Tragic $40,287 |
| Choctaw | 0.0 /100 | #313 | Tragic $40,270 |
| Cheyenne | 0.0 /100 | #314 | Tragic $40,233 |
| Seminole | 0.0 /100 | #315 | Tragic $40,233 |
| Immigrants | Honduras | 0.0 /100 | #316 | Tragic $40,195 |
| Fijians | 0.0 /100 | #317 | Tragic $40,193 |
| Dutch West Indians | 0.0 /100 | #318 | Tragic $40,107 |
| Blacks/African Americans | 0.0 /100 | #319 | Tragic $40,085 |
| Immigrants | Bahamas | 0.0 /100 | #320 | Tragic $39,861 |
| Mexicans | 0.0 /100 | #321 | Tragic $39,834 |
| Immigrants | Central America | 0.0 /100 | #322 | Tragic $39,762 |
| Bahamians | 0.0 /100 | #323 | Tragic $39,735 |
Demographics Similar to Immigrants from Fiji by Median Earnings
In terms of median earnings, the demographic groups most similar to Immigrants from Fiji are Assyrian/Chaldean/Syriac ($48,304, a difference of 0.0%), Sierra Leonean ($48,286, a difference of 0.040%), Immigrants from Philippines ($48,266, a difference of 0.080%), Brazilian ($48,356, a difference of 0.11%), and Pakistani ($48,254, a difference of 0.11%).
| Demographics | Rating | Rank | Median Earnings |
| Immigrants | Jordan | 95.9 /100 | #118 | Exceptional $48,673 |
| Poles | 95.8 /100 | #119 | Exceptional $48,659 |
| Carpatho Rusyns | 95.5 /100 | #120 | Exceptional $48,617 |
| Arabs | 95.4 /100 | #121 | Exceptional $48,599 |
| Chileans | 94.8 /100 | #122 | Exceptional $48,504 |
| Immigrants | Syria | 93.9 /100 | #123 | Exceptional $48,375 |
| Brazilians | 93.7 /100 | #124 | Exceptional $48,356 |
| Immigrants | Fiji | 93.3 /100 | #125 | Exceptional $48,305 |
| Assyrians/Chaldeans/Syriacs | 93.3 /100 | #126 | Exceptional $48,304 |
| Sierra Leoneans | 93.1 /100 | #127 | Exceptional $48,286 |
| Immigrants | Philippines | 92.9 /100 | #128 | Exceptional $48,266 |
| Pakistanis | 92.8 /100 | #129 | Exceptional $48,254 |
| Zimbabweans | 92.6 /100 | #130 | Exceptional $48,229 |
| Lebanese | 92.5 /100 | #131 | Exceptional $48,226 |
| British | 92.2 /100 | #132 | Exceptional $48,189 |