Immigrants from Brazil vs Bahamian Median Household Income
COMPARE
Immigrants from Brazil
Bahamian
Median Household Income
Median Household Income Comparison
Immigrants from Brazil
Bahamians
$90,907
MEDIAN HOUSEHOLD INCOME
97.7/ 100
METRIC RATING
105th/ 347
METRIC RANK
$69,726
MEDIAN HOUSEHOLD INCOME
0.0/ 100
METRIC RATING
323rd/ 347
METRIC RANK
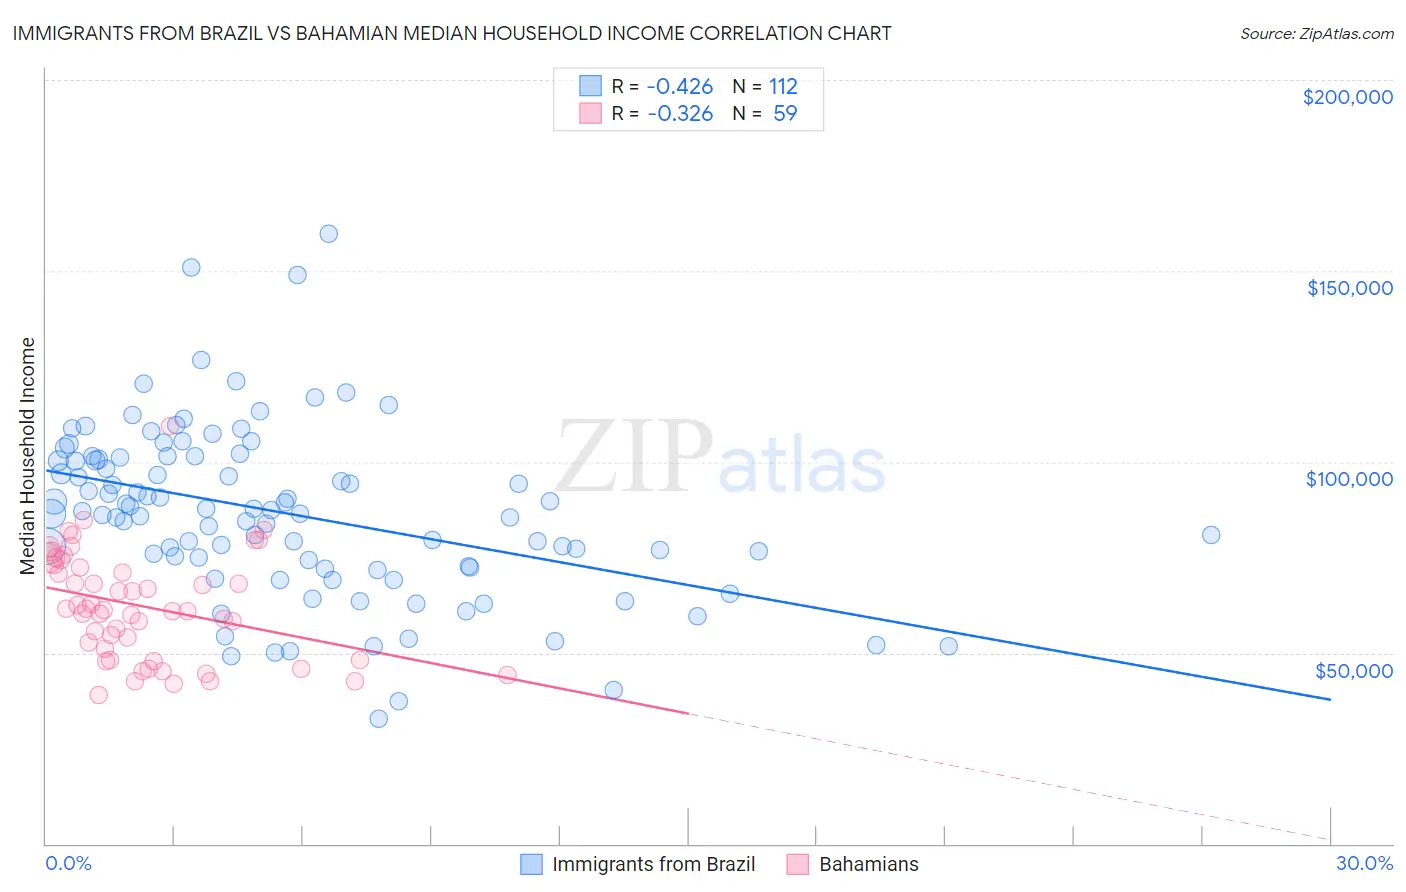
Immigrants from Brazil vs Bahamian Median Household Income Correlation Chart
The statistical analysis conducted on geographies consisting of 342,806,589 people shows a moderate negative correlation between the proportion of Immigrants from Brazil and median household income in the United States with a correlation coefficient (R) of -0.426 and weighted average of $90,907. Similarly, the statistical analysis conducted on geographies consisting of 112,607,468 people shows a mild negative correlation between the proportion of Bahamians and median household income in the United States with a correlation coefficient (R) of -0.326 and weighted average of $69,726, a difference of 30.4%.
Median Household Income Correlation Summary
| Measurement | Immigrants from Brazil | Bahamian |
| Minimum | $32,591 | $38,952 |
| Maximum | $159,719 | $109,393 |
| Range | $127,128 | $70,441 |
| Mean | $86,451 | $62,193 |
| Median | $86,864 | $61,085 |
| Interquartile 25% (IQ1) | $72,377 | $48,214 |
| Interquartile 75% (IQ3) | $100,910 | $73,042 |
| Interquartile Range (IQR) | $28,533 | $24,828 |
| Standard Deviation (Sample) | $22,561 | $14,104 |
| Standard Deviation (Population) | $22,460 | $13,984 |
Similar Demographics by Median Household Income
Demographics Similar to Immigrants from Brazil by Median Household Income
In terms of median household income, the demographic groups most similar to Immigrants from Brazil are Immigrants from Kazakhstan ($91,015, a difference of 0.12%), Macedonian ($90,761, a difference of 0.16%), Immigrants from Ukraine ($91,124, a difference of 0.24%), Croatian ($90,685, a difference of 0.25%), and Zimbabwean ($90,618, a difference of 0.32%).
| Demographics | Rating | Rank | Median Household Income |
| Immigrants | Southern Europe | 98.5 /100 | #98 | Exceptional $91,605 |
| Immigrants | South Eastern Asia | 98.4 /100 | #99 | Exceptional $91,541 |
| Ukrainians | 98.3 /100 | #100 | Exceptional $91,456 |
| Immigrants | Moldova | 98.3 /100 | #101 | Exceptional $91,446 |
| Austrians | 98.2 /100 | #102 | Exceptional $91,339 |
| Immigrants | Ukraine | 98.0 /100 | #103 | Exceptional $91,124 |
| Immigrants | Kazakhstan | 97.8 /100 | #104 | Exceptional $91,015 |
| Immigrants | Brazil | 97.7 /100 | #105 | Exceptional $90,907 |
| Macedonians | 97.4 /100 | #106 | Exceptional $90,761 |
| Croatians | 97.3 /100 | #107 | Exceptional $90,685 |
| Zimbabweans | 97.2 /100 | #108 | Exceptional $90,618 |
| Chileans | 97.2 /100 | #109 | Exceptional $90,605 |
| Palestinians | 97.1 /100 | #110 | Exceptional $90,574 |
| Immigrants | Poland | 97.1 /100 | #111 | Exceptional $90,549 |
| Northern Europeans | 96.9 /100 | #112 | Exceptional $90,446 |
Demographics Similar to Bahamians by Median Household Income
In terms of median household income, the demographic groups most similar to Bahamians are Yup'ik ($69,695, a difference of 0.040%), Choctaw ($69,947, a difference of 0.32%), Chickasaw ($70,005, a difference of 0.40%), Seminole ($69,420, a difference of 0.44%), and Colville ($70,094, a difference of 0.53%).
| Demographics | Rating | Rank | Median Household Income |
| Apache | 0.0 /100 | #316 | Tragic $70,927 |
| Cajuns | 0.0 /100 | #317 | Tragic $70,605 |
| Chippewa | 0.0 /100 | #318 | Tragic $70,539 |
| Immigrants | Dominican Republic | 0.0 /100 | #319 | Tragic $70,208 |
| Colville | 0.0 /100 | #320 | Tragic $70,094 |
| Chickasaw | 0.0 /100 | #321 | Tragic $70,005 |
| Choctaw | 0.0 /100 | #322 | Tragic $69,947 |
| Bahamians | 0.0 /100 | #323 | Tragic $69,726 |
| Yup'ik | 0.0 /100 | #324 | Tragic $69,695 |
| Seminole | 0.0 /100 | #325 | Tragic $69,420 |
| Yuman | 0.0 /100 | #326 | Tragic $68,743 |
| Immigrants | Cuba | 0.0 /100 | #327 | Tragic $68,461 |
| Menominee | 0.0 /100 | #328 | Tragic $68,423 |
| Dutch West Indians | 0.0 /100 | #329 | Tragic $68,412 |
| Arapaho | 0.0 /100 | #330 | Tragic $67,965 |