Immigrants from Barbados vs Czech Householder Income Ages 45 - 64 years
COMPARE
Immigrants from Barbados
Czech
Householder Income Ages 45 - 64 years
Householder Income Ages 45 - 64 years Comparison
Immigrants from Barbados
Czechs
$89,394
HOUSEHOLDER INCOME AGES 45 - 64 YEARS
0.4/ 100
METRIC RATING
258th/ 347
METRIC RANK
$103,507
HOUSEHOLDER INCOME AGES 45 - 64 YEARS
83.1/ 100
METRIC RATING
144th/ 347
METRIC RANK
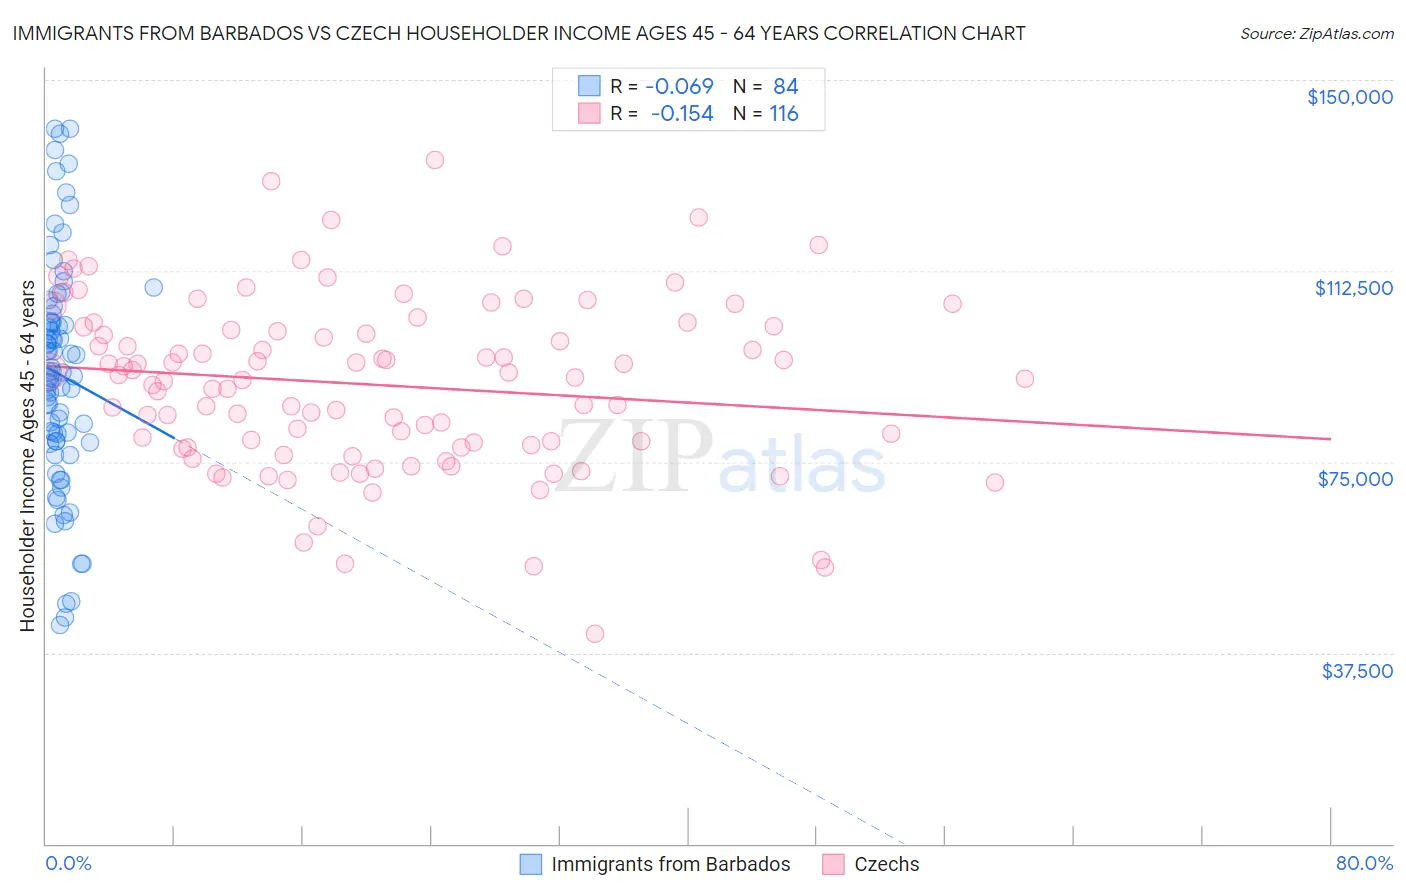
Immigrants from Barbados vs Czech Householder Income Ages 45 - 64 years Correlation Chart
The statistical analysis conducted on geographies consisting of 112,734,331 people shows a slight negative correlation between the proportion of Immigrants from Barbados and household income with householder between the ages 45 and 64 in the United States with a correlation coefficient (R) of -0.069 and weighted average of $89,394. Similarly, the statistical analysis conducted on geographies consisting of 483,421,339 people shows a poor negative correlation between the proportion of Czechs and household income with householder between the ages 45 and 64 in the United States with a correlation coefficient (R) of -0.154 and weighted average of $103,507, a difference of 15.8%.
Householder Income Ages 45 - 64 years Correlation Summary
| Measurement | Immigrants from Barbados | Czech |
| Minimum | $42,917 | $41,250 |
| Maximum | $140,429 | $134,167 |
| Range | $97,512 | $92,917 |
| Mean | $92,160 | $90,131 |
| Median | $92,269 | $91,354 |
| Interquartile 25% (IQ1) | $79,098 | $78,110 |
| Interquartile 75% (IQ3) | $102,596 | $101,246 |
| Interquartile Range (IQR) | $23,498 | $23,136 |
| Standard Deviation (Sample) | $21,991 | $16,799 |
| Standard Deviation (Population) | $21,860 | $16,726 |
Similar Demographics by Householder Income Ages 45 - 64 years
Demographics Similar to Immigrants from Barbados by Householder Income Ages 45 - 64 years
In terms of householder income ages 45 - 64 years, the demographic groups most similar to Immigrants from Barbados are German Russian ($89,398, a difference of 0.0%), Immigrants from Nicaragua ($89,108, a difference of 0.32%), French American Indian ($89,811, a difference of 0.47%), Liberian ($88,929, a difference of 0.52%), and West Indian ($89,906, a difference of 0.57%).
| Demographics | Rating | Rank | Householder Income Ages 45 - 64 years |
| Americans | 0.7 /100 | #251 | Tragic $90,536 |
| Marshallese | 0.7 /100 | #252 | Tragic $90,455 |
| Barbadians | 0.6 /100 | #253 | Tragic $90,266 |
| Immigrants | Guyana | 0.6 /100 | #254 | Tragic $90,186 |
| West Indians | 0.5 /100 | #255 | Tragic $89,906 |
| French American Indians | 0.5 /100 | #256 | Tragic $89,811 |
| German Russians | 0.4 /100 | #257 | Tragic $89,398 |
| Immigrants | Barbados | 0.4 /100 | #258 | Tragic $89,394 |
| Immigrants | Nicaragua | 0.4 /100 | #259 | Tragic $89,108 |
| Liberians | 0.3 /100 | #260 | Tragic $88,929 |
| Belizeans | 0.3 /100 | #261 | Tragic $88,684 |
| Somalis | 0.3 /100 | #262 | Tragic $88,600 |
| Immigrants | Senegal | 0.3 /100 | #263 | Tragic $88,421 |
| Osage | 0.3 /100 | #264 | Tragic $88,390 |
| Jamaicans | 0.2 /100 | #265 | Tragic $88,327 |
Demographics Similar to Czechs by Householder Income Ages 45 - 64 years
In terms of householder income ages 45 - 64 years, the demographic groups most similar to Czechs are Serbian ($103,522, a difference of 0.010%), Luxembourger ($103,536, a difference of 0.030%), Ugandan ($103,472, a difference of 0.030%), Immigrants from Uganda ($103,584, a difference of 0.070%), and Immigrants from Chile ($103,412, a difference of 0.090%).
| Demographics | Rating | Rank | Householder Income Ages 45 - 64 years |
| Hungarians | 85.8 /100 | #137 | Excellent $103,913 |
| Ethiopians | 84.7 /100 | #138 | Excellent $103,736 |
| Immigrants | Oceania | 84.5 /100 | #139 | Excellent $103,705 |
| Norwegians | 84.3 /100 | #140 | Excellent $103,682 |
| Immigrants | Uganda | 83.7 /100 | #141 | Excellent $103,584 |
| Luxembourgers | 83.3 /100 | #142 | Excellent $103,536 |
| Serbians | 83.2 /100 | #143 | Excellent $103,522 |
| Czechs | 83.1 /100 | #144 | Excellent $103,507 |
| Ugandans | 82.9 /100 | #145 | Excellent $103,472 |
| Immigrants | Chile | 82.5 /100 | #146 | Excellent $103,412 |
| Basques | 82.3 /100 | #147 | Excellent $103,387 |
| Immigrants | Germany | 81.5 /100 | #148 | Excellent $103,282 |
| Immigrants | Sierra Leone | 81.1 /100 | #149 | Excellent $103,227 |
| Immigrants | Peru | 80.7 /100 | #150 | Excellent $103,173 |
| Swiss | 79.9 /100 | #151 | Good $103,071 |