Assyrian/Chaldean/Syriac vs Czech Unemployment Among Ages 30 to 34 years
COMPARE
Assyrian/Chaldean/Syriac
Czech
Unemployment Among Ages 30 to 34 years
Unemployment Among Ages 30 to 34 years Comparison
Assyrians/Chaldeans/Syriacs
Czechs
5.1%
UNEMPLOYMENT AMONG AGES 30 TO 34 YEARS
98.4/ 100
METRIC RATING
48th/ 347
METRIC RANK
5.0%
UNEMPLOYMENT AMONG AGES 30 TO 34 YEARS
99.2/ 100
METRIC RATING
36th/ 347
METRIC RANK
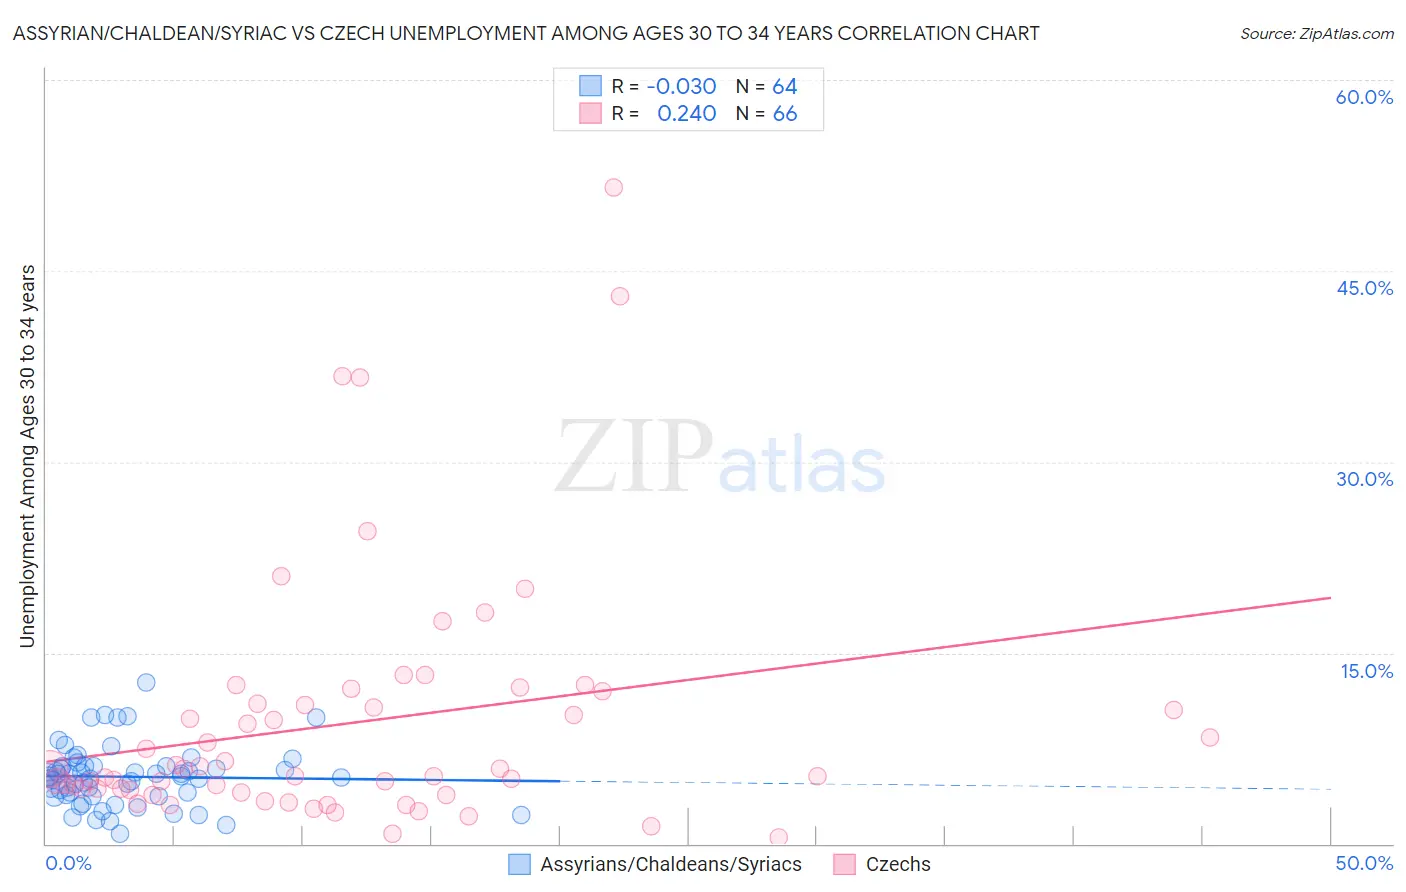
Assyrian/Chaldean/Syriac vs Czech Unemployment Among Ages 30 to 34 years Correlation Chart
The statistical analysis conducted on geographies consisting of 108,429,233 people shows no correlation between the proportion of Assyrians/Chaldeans/Syriacs and unemployment rate among population between the ages 30 and 34 in the United States with a correlation coefficient (R) of -0.030 and weighted average of 5.1%. Similarly, the statistical analysis conducted on geographies consisting of 438,540,719 people shows a weak positive correlation between the proportion of Czechs and unemployment rate among population between the ages 30 and 34 in the United States with a correlation coefficient (R) of 0.240 and weighted average of 5.0%, a difference of 1.3%.
Unemployment Among Ages 30 to 34 years Correlation Summary
| Measurement | Assyrian/Chaldean/Syriac | Czech |
| Minimum | 0.80% | 0.50% |
| Maximum | 12.6% | 51.6% |
| Range | 11.8% | 51.1% |
| Mean | 5.3% | 9.5% |
| Median | 5.2% | 5.6% |
| Interquartile 25% (IQ1) | 3.8% | 4.2% |
| Interquartile 75% (IQ3) | 6.1% | 11.0% |
| Interquartile Range (IQR) | 2.3% | 6.7% |
| Standard Deviation (Sample) | 2.3% | 9.8% |
| Standard Deviation (Population) | 2.3% | 9.7% |
Demographics Similar to Assyrians/Chaldeans/Syriacs and Czechs by Unemployment Among Ages 30 to 34 years
In terms of unemployment among ages 30 to 34 years, the demographic groups most similar to Assyrians/Chaldeans/Syriacs are Cypriot (5.1%, a difference of 0.020%), Immigrants from Congo (5.1%, a difference of 0.040%), Immigrants from Malaysia (5.1%, a difference of 0.12%), Puget Sound Salish (5.1%, a difference of 0.20%), and Turkish (5.1%, a difference of 0.23%). Similarly, the demographic groups most similar to Czechs are Immigrants from Ethiopia (5.0%, a difference of 0.040%), Immigrants from Turkey (5.0%, a difference of 0.25%), Sri Lankan (5.0%, a difference of 0.25%), Latvian (5.0%, a difference of 0.28%), and Immigrants from Saudi Arabia (5.0%, a difference of 0.32%).
| Demographics | Rating | Rank | Unemployment Among Ages 30 to 34 years |
| Immigrants | Zaire | 99.3 /100 | #32 | Exceptional 5.0% |
| Immigrants | Saudi Arabia | 99.3 /100 | #33 | Exceptional 5.0% |
| Latvians | 99.3 /100 | #34 | Exceptional 5.0% |
| Immigrants | Ethiopia | 99.2 /100 | #35 | Exceptional 5.0% |
| Czechs | 99.2 /100 | #36 | Exceptional 5.0% |
| Immigrants | Turkey | 99.0 /100 | #37 | Exceptional 5.0% |
| Sri Lankans | 99.0 /100 | #38 | Exceptional 5.0% |
| Fijians | 99.0 /100 | #39 | Exceptional 5.0% |
| Immigrants | Vietnam | 98.9 /100 | #40 | Exceptional 5.0% |
| Immigrants | Eastern Africa | 98.9 /100 | #41 | Exceptional 5.0% |
| Immigrants | Hong Kong | 98.8 /100 | #42 | Exceptional 5.0% |
| Soviet Union | 98.8 /100 | #43 | Exceptional 5.0% |
| Immigrants | Belgium | 98.7 /100 | #44 | Exceptional 5.1% |
| Yugoslavians | 98.6 /100 | #45 | Exceptional 5.1% |
| Immigrants | Congo | 98.4 /100 | #46 | Exceptional 5.1% |
| Cypriots | 98.4 /100 | #47 | Exceptional 5.1% |
| Assyrians/Chaldeans/Syriacs | 98.4 /100 | #48 | Exceptional 5.1% |
| Immigrants | Malaysia | 98.3 /100 | #49 | Exceptional 5.1% |
| Puget Sound Salish | 98.2 /100 | #50 | Exceptional 5.1% |
| Turks | 98.2 /100 | #51 | Exceptional 5.1% |
| Immigrants | Burma/Myanmar | 98.1 /100 | #52 | Exceptional 5.1% |