Immigrants from Eastern Europe vs South American Indian Householder Income Ages 45 - 64 years
COMPARE
Immigrants from Eastern Europe
South American Indian
Householder Income Ages 45 - 64 years
Householder Income Ages 45 - 64 years Comparison
Immigrants from Eastern Europe
South American Indians
$109,335
HOUSEHOLDER INCOME AGES 45 - 64 YEARS
98.9/ 100
METRIC RATING
81st/ 347
METRIC RANK
$101,171
HOUSEHOLDER INCOME AGES 45 - 64 YEARS
60.5/ 100
METRIC RATING
168th/ 347
METRIC RANK
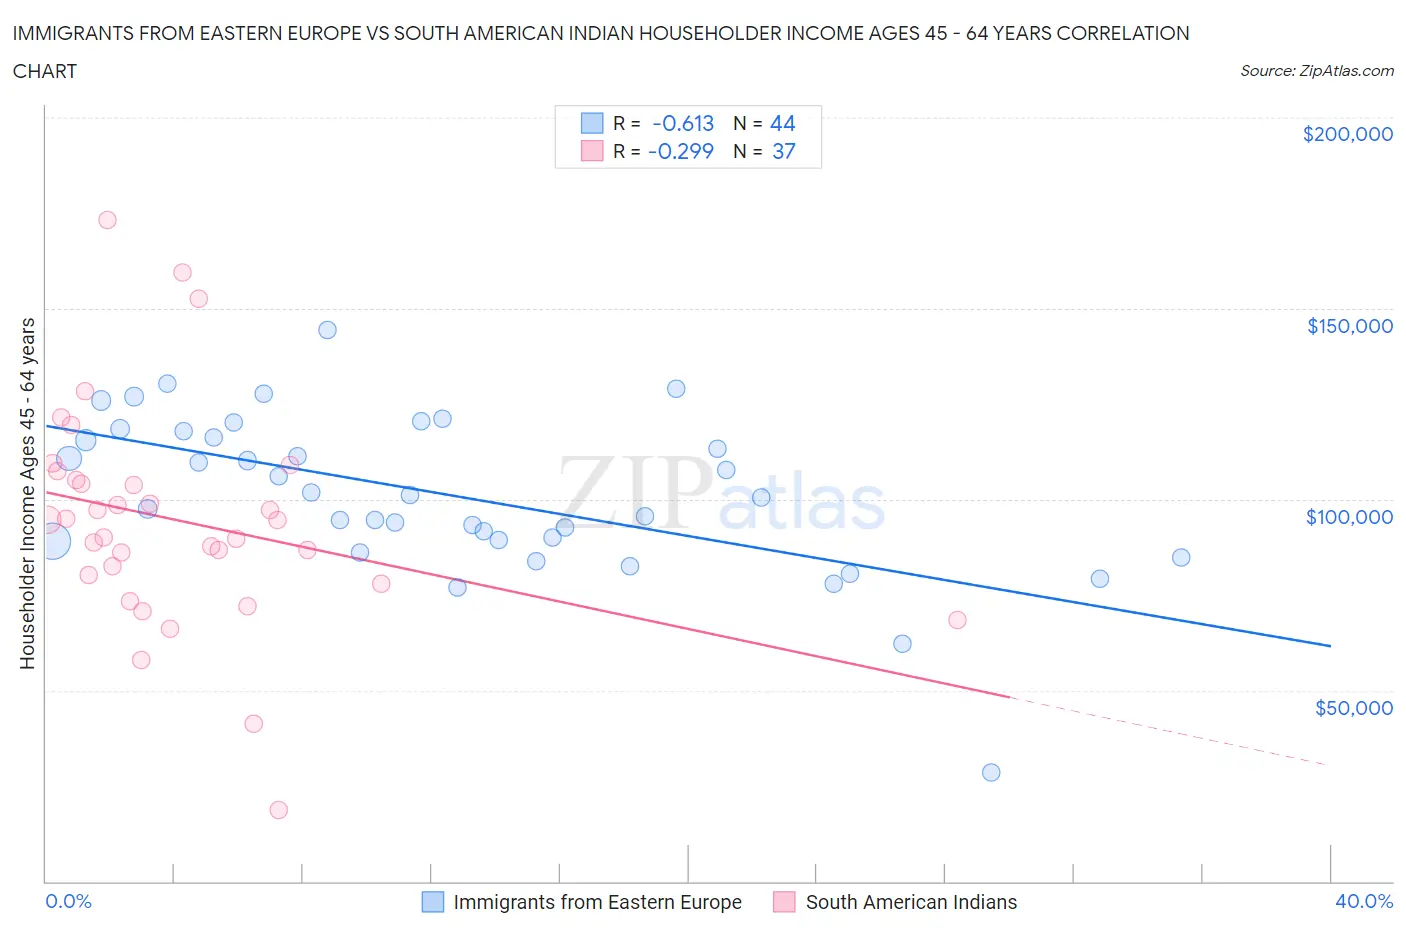
Immigrants from Eastern Europe vs South American Indian Householder Income Ages 45 - 64 years Correlation Chart
The statistical analysis conducted on geographies consisting of 474,661,335 people shows a significant negative correlation between the proportion of Immigrants from Eastern Europe and household income with householder between the ages 45 and 64 in the United States with a correlation coefficient (R) of -0.613 and weighted average of $109,335. Similarly, the statistical analysis conducted on geographies consisting of 164,498,576 people shows a weak negative correlation between the proportion of South American Indians and household income with householder between the ages 45 and 64 in the United States with a correlation coefficient (R) of -0.299 and weighted average of $101,171, a difference of 8.1%.
Householder Income Ages 45 - 64 years Correlation Summary
| Measurement | Immigrants from Eastern Europe | South American Indian |
| Minimum | $28,542 | $18,682 |
| Maximum | $144,195 | $173,033 |
| Range | $115,653 | $154,351 |
| Mean | $101,147 | $94,461 |
| Median | $100,823 | $94,583 |
| Interquartile 25% (IQ1) | $89,240 | $79,132 |
| Interquartile 75% (IQ3) | $117,050 | $106,330 |
| Interquartile Range (IQR) | $27,809 | $27,199 |
| Standard Deviation (Sample) | $20,985 | $29,348 |
| Standard Deviation (Population) | $20,746 | $28,948 |
Similar Demographics by Householder Income Ages 45 - 64 years
Demographics Similar to Immigrants from Eastern Europe by Householder Income Ages 45 - 64 years
In terms of householder income ages 45 - 64 years, the demographic groups most similar to Immigrants from Eastern Europe are Immigrants from Bulgaria ($109,379, a difference of 0.040%), Jordanian ($109,376, a difference of 0.040%), Immigrants from Canada ($109,402, a difference of 0.060%), Paraguayan ($109,447, a difference of 0.10%), and Immigrants from England ($109,446, a difference of 0.10%).
| Demographics | Rating | Rank | Householder Income Ages 45 - 64 years |
| Immigrants | Egypt | 99.2 /100 | #74 | Exceptional $109,941 |
| South Africans | 99.1 /100 | #75 | Exceptional $109,719 |
| Paraguayans | 99.0 /100 | #76 | Exceptional $109,447 |
| Immigrants | England | 99.0 /100 | #77 | Exceptional $109,446 |
| Immigrants | Canada | 99.0 /100 | #78 | Exceptional $109,402 |
| Immigrants | Bulgaria | 98.9 /100 | #79 | Exceptional $109,379 |
| Jordanians | 98.9 /100 | #80 | Exceptional $109,376 |
| Immigrants | Eastern Europe | 98.9 /100 | #81 | Exceptional $109,335 |
| Immigrants | North America | 98.8 /100 | #82 | Exceptional $109,198 |
| Immigrants | Spain | 98.8 /100 | #83 | Exceptional $109,051 |
| Immigrants | Western Europe | 98.6 /100 | #84 | Exceptional $108,824 |
| Immigrants | Afghanistan | 98.6 /100 | #85 | Exceptional $108,785 |
| Austrians | 98.5 /100 | #86 | Exceptional $108,692 |
| Tongans | 98.5 /100 | #87 | Exceptional $108,643 |
| Romanians | 98.5 /100 | #88 | Exceptional $108,609 |
Demographics Similar to South American Indians by Householder Income Ages 45 - 64 years
In terms of householder income ages 45 - 64 years, the demographic groups most similar to South American Indians are Guamanian/Chamorro ($101,170, a difference of 0.0%), Slovak ($101,029, a difference of 0.14%), Czechoslovakian ($101,387, a difference of 0.21%), South American ($100,837, a difference of 0.33%), and Samoan ($101,580, a difference of 0.40%).
| Demographics | Rating | Rank | Householder Income Ages 45 - 64 years |
| Immigrants | Nepal | 71.8 /100 | #161 | Good $102,190 |
| Scottish | 71.1 /100 | #162 | Good $102,123 |
| English | 70.1 /100 | #163 | Good $102,021 |
| Immigrants | Morocco | 70.0 /100 | #164 | Good $102,015 |
| Immigrants | Albania | 69.4 /100 | #165 | Good $101,957 |
| Samoans | 65.3 /100 | #166 | Good $101,580 |
| Czechoslovakians | 63.0 /100 | #167 | Good $101,387 |
| South American Indians | 60.5 /100 | #168 | Good $101,171 |
| Guamanians/Chamorros | 60.5 /100 | #169 | Good $101,170 |
| Slovaks | 58.8 /100 | #170 | Average $101,029 |
| South Americans | 56.4 /100 | #171 | Average $100,837 |
| Immigrants | Uzbekistan | 52.5 /100 | #172 | Average $100,523 |
| Alsatians | 51.4 /100 | #173 | Average $100,435 |
| Welsh | 50.0 /100 | #174 | Average $100,322 |
| Germans | 48.8 /100 | #175 | Average $100,224 |