Immigrants from South America vs South American Indian Householder Income Ages 45 - 64 years
COMPARE
Immigrants from South America
South American Indian
Householder Income Ages 45 - 64 years
Householder Income Ages 45 - 64 years Comparison
Immigrants from South America
South American Indians
$99,126
HOUSEHOLDER INCOME AGES 45 - 64 YEARS
35.4/ 100
METRIC RATING
189th/ 347
METRIC RANK
$101,171
HOUSEHOLDER INCOME AGES 45 - 64 YEARS
60.5/ 100
METRIC RATING
168th/ 347
METRIC RANK
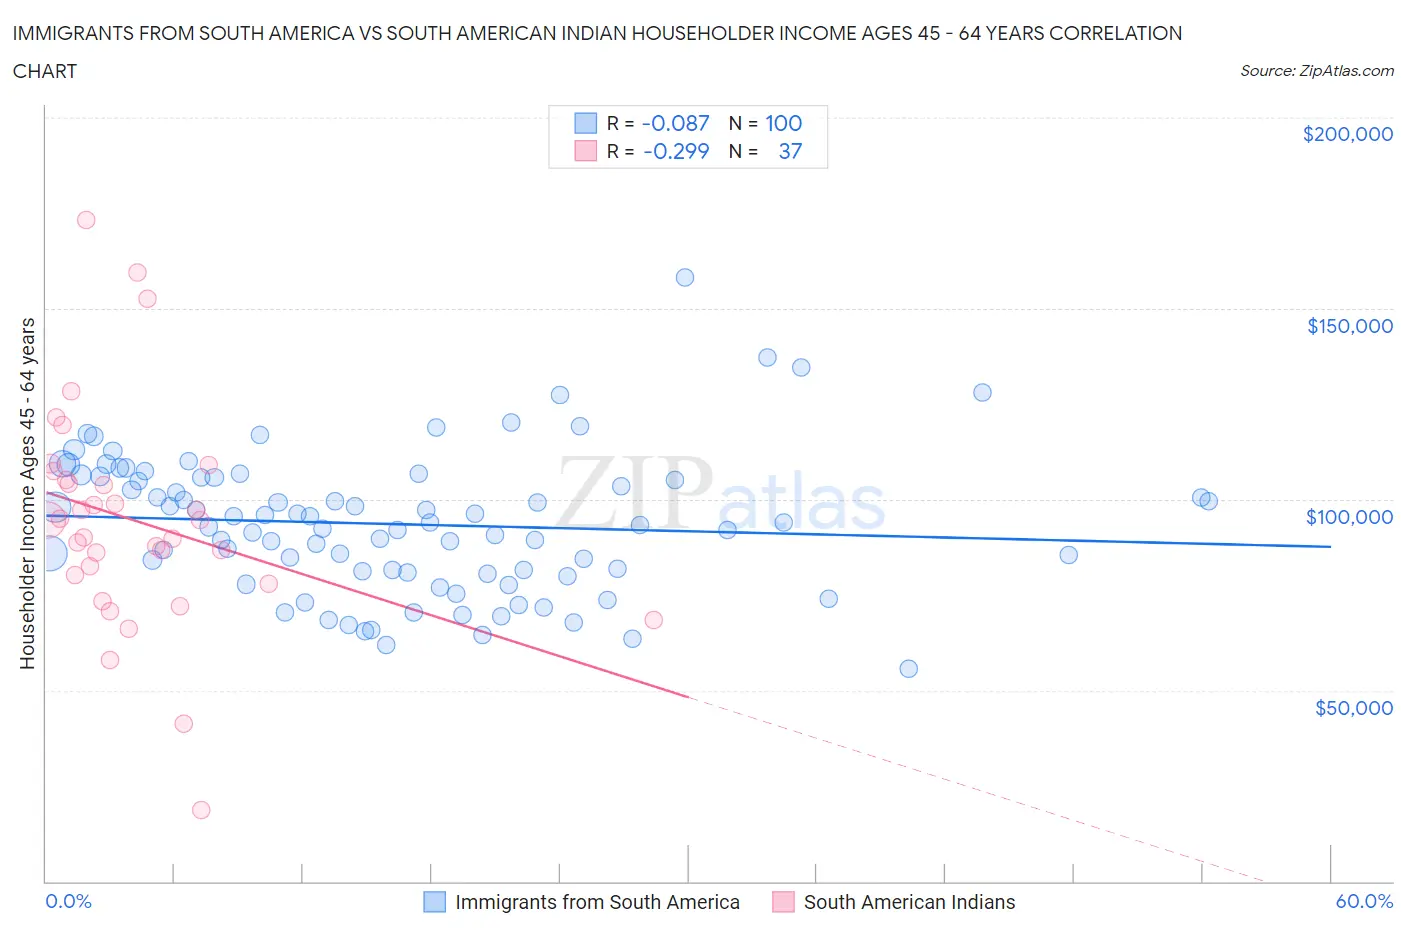
Immigrants from South America vs South American Indian Householder Income Ages 45 - 64 years Correlation Chart
The statistical analysis conducted on geographies consisting of 485,109,583 people shows a slight negative correlation between the proportion of Immigrants from South America and household income with householder between the ages 45 and 64 in the United States with a correlation coefficient (R) of -0.087 and weighted average of $99,126. Similarly, the statistical analysis conducted on geographies consisting of 164,498,576 people shows a weak negative correlation between the proportion of South American Indians and household income with householder between the ages 45 and 64 in the United States with a correlation coefficient (R) of -0.299 and weighted average of $101,171, a difference of 2.1%.
Householder Income Ages 45 - 64 years Correlation Summary
| Measurement | Immigrants from South America | South American Indian |
| Minimum | $55,625 | $18,682 |
| Maximum | $158,009 | $173,033 |
| Range | $102,384 | $154,351 |
| Mean | $93,526 | $94,461 |
| Median | $93,699 | $94,583 |
| Interquartile 25% (IQ1) | $80,877 | $79,132 |
| Interquartile 75% (IQ3) | $105,801 | $106,330 |
| Interquartile Range (IQR) | $24,923 | $27,199 |
| Standard Deviation (Sample) | $18,231 | $29,348 |
| Standard Deviation (Population) | $18,139 | $28,948 |
Similar Demographics by Householder Income Ages 45 - 64 years
Demographics Similar to Immigrants from South America by Householder Income Ages 45 - 64 years
In terms of householder income ages 45 - 64 years, the demographic groups most similar to Immigrants from South America are French Canadian ($99,093, a difference of 0.030%), Immigrants from Portugal ($99,203, a difference of 0.080%), Kenyan ($98,970, a difference of 0.16%), Celtic ($98,896, a difference of 0.23%), and Iraqi ($99,387, a difference of 0.26%).
| Demographics | Rating | Rank | Householder Income Ages 45 - 64 years |
| Finns | 44.8 /100 | #182 | Average $99,904 |
| Spaniards | 44.6 /100 | #183 | Average $99,889 |
| French | 43.8 /100 | #184 | Average $99,824 |
| Colombians | 43.2 /100 | #185 | Average $99,772 |
| Dutch | 41.7 /100 | #186 | Average $99,650 |
| Iraqis | 38.5 /100 | #187 | Fair $99,387 |
| Immigrants | Portugal | 36.3 /100 | #188 | Fair $99,203 |
| Immigrants | South America | 35.4 /100 | #189 | Fair $99,126 |
| French Canadians | 35.1 /100 | #190 | Fair $99,093 |
| Kenyans | 33.7 /100 | #191 | Fair $98,970 |
| Celtics | 32.9 /100 | #192 | Fair $98,896 |
| Hawaiians | 31.6 /100 | #193 | Fair $98,778 |
| Uruguayans | 30.3 /100 | #194 | Fair $98,660 |
| Spanish | 29.2 /100 | #195 | Fair $98,554 |
| Immigrants | Eastern Africa | 28.3 /100 | #196 | Fair $98,467 |
Demographics Similar to South American Indians by Householder Income Ages 45 - 64 years
In terms of householder income ages 45 - 64 years, the demographic groups most similar to South American Indians are Guamanian/Chamorro ($101,170, a difference of 0.0%), Slovak ($101,029, a difference of 0.14%), Czechoslovakian ($101,387, a difference of 0.21%), South American ($100,837, a difference of 0.33%), and Samoan ($101,580, a difference of 0.40%).
| Demographics | Rating | Rank | Householder Income Ages 45 - 64 years |
| Immigrants | Nepal | 71.8 /100 | #161 | Good $102,190 |
| Scottish | 71.1 /100 | #162 | Good $102,123 |
| English | 70.1 /100 | #163 | Good $102,021 |
| Immigrants | Morocco | 70.0 /100 | #164 | Good $102,015 |
| Immigrants | Albania | 69.4 /100 | #165 | Good $101,957 |
| Samoans | 65.3 /100 | #166 | Good $101,580 |
| Czechoslovakians | 63.0 /100 | #167 | Good $101,387 |
| South American Indians | 60.5 /100 | #168 | Good $101,171 |
| Guamanians/Chamorros | 60.5 /100 | #169 | Good $101,170 |
| Slovaks | 58.8 /100 | #170 | Average $101,029 |
| South Americans | 56.4 /100 | #171 | Average $100,837 |
| Immigrants | Uzbekistan | 52.5 /100 | #172 | Average $100,523 |
| Alsatians | 51.4 /100 | #173 | Average $100,435 |
| Welsh | 50.0 /100 | #174 | Average $100,322 |
| Germans | 48.8 /100 | #175 | Average $100,224 |