Asian vs Delaware No Vehicles in Household
COMPARE
Asian
Delaware
No Vehicles in Household
No Vehicles in Household Comparison
Asians
Delaware
9.0%
NO VEHICLES IN HOUSEHOLD
98.3/ 100
METRIC RATING
100th/ 347
METRIC RANK
9.2%
NO VEHICLES IN HOUSEHOLD
97.2/ 100
METRIC RATING
110th/ 347
METRIC RANK
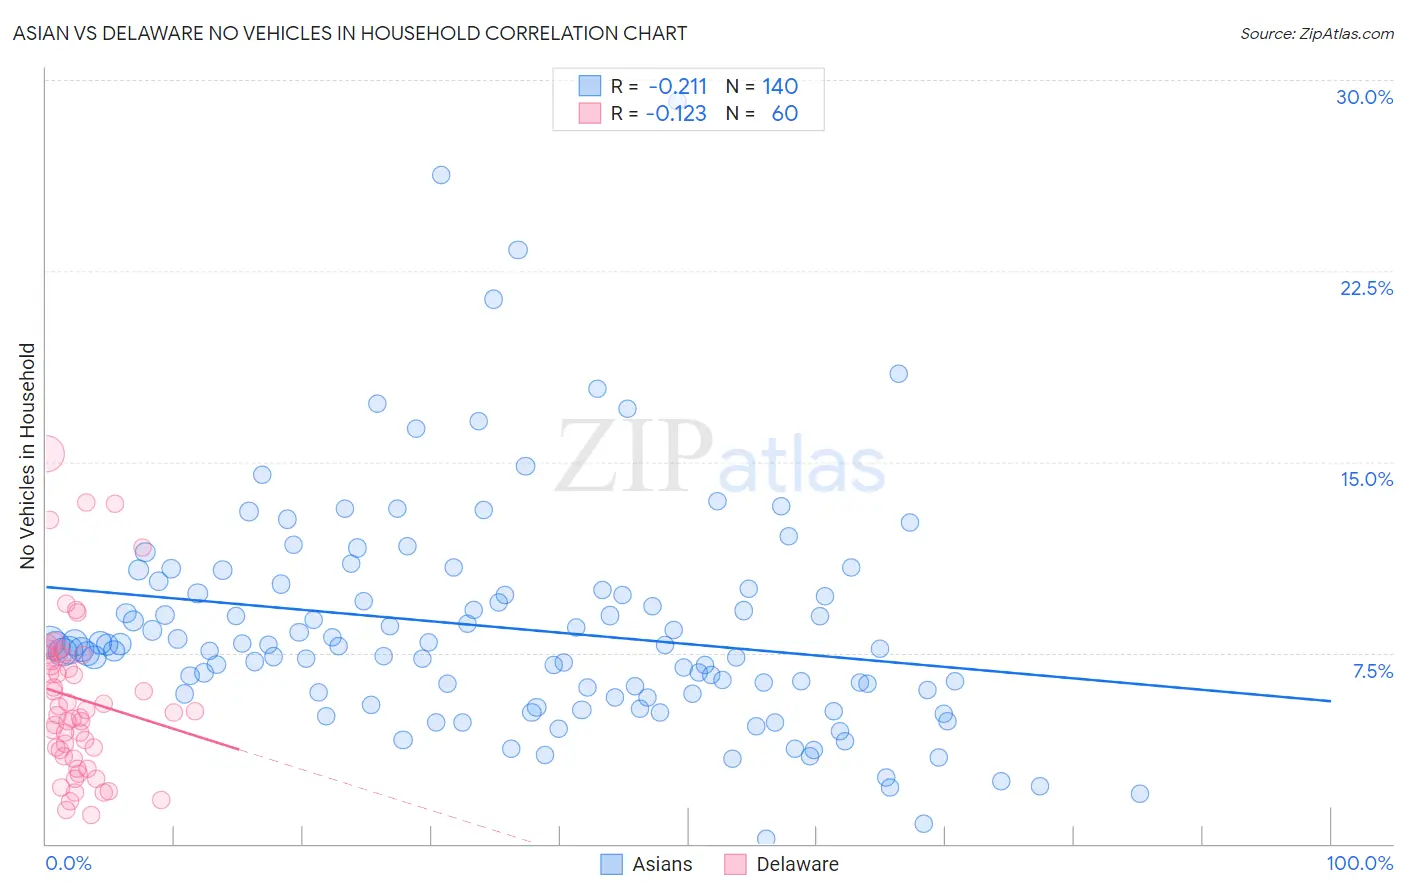
Asian vs Delaware No Vehicles in Household Correlation Chart
The statistical analysis conducted on geographies consisting of 534,555,995 people shows a weak negative correlation between the proportion of Asians and percentage of households with no vehicle available in the United States with a correlation coefficient (R) of -0.211 and weighted average of 9.0%. Similarly, the statistical analysis conducted on geographies consisting of 96,153,948 people shows a poor negative correlation between the proportion of Delaware and percentage of households with no vehicle available in the United States with a correlation coefficient (R) of -0.123 and weighted average of 9.2%, a difference of 2.0%.
No Vehicles in Household Correlation Summary
| Measurement | Asian | Delaware |
| Minimum | 0.21% | 1.1% |
| Maximum | 29.2% | 15.3% |
| Range | 29.0% | 14.2% |
| Mean | 8.5% | 5.7% |
| Median | 7.7% | 5.2% |
| Interquartile 25% (IQ1) | 5.9% | 3.5% |
| Interquartile 75% (IQ3) | 9.9% | 7.4% |
| Interquartile Range (IQR) | 4.0% | 3.8% |
| Standard Deviation (Sample) | 4.5% | 3.1% |
| Standard Deviation (Population) | 4.5% | 3.1% |
Demographics Similar to Asians and Delaware by No Vehicles in Household
In terms of no vehicles in household, the demographic groups most similar to Asians are Pakistani (9.0%, a difference of 0.040%), Yugoslavian (9.0%, a difference of 0.080%), Seminole (9.0%, a difference of 0.080%), Bulgarian (9.0%, a difference of 0.18%), and Slavic (9.0%, a difference of 0.24%). Similarly, the demographic groups most similar to Delaware are Maltese (9.1%, a difference of 0.58%), Mexican American Indian (9.1%, a difference of 0.71%), Hispanic or Latino (9.1%, a difference of 0.79%), Laotian (9.1%, a difference of 1.1%), and Spanish American (9.1%, a difference of 1.1%).
| Demographics | Rating | Rank | No Vehicles in Household |
| Potawatomi | 98.8 /100 | #95 | Exceptional 8.8% |
| Immigrants | Bolivia | 98.7 /100 | #96 | Exceptional 8.9% |
| Immigrants | Central America | 98.5 /100 | #97 | Exceptional 8.9% |
| Slavs | 98.4 /100 | #98 | Exceptional 9.0% |
| Bulgarians | 98.4 /100 | #99 | Exceptional 9.0% |
| Asians | 98.3 /100 | #100 | Exceptional 9.0% |
| Pakistanis | 98.3 /100 | #101 | Exceptional 9.0% |
| Yugoslavians | 98.3 /100 | #102 | Exceptional 9.0% |
| Seminole | 98.3 /100 | #103 | Exceptional 9.0% |
| Zimbabweans | 98.0 /100 | #104 | Exceptional 9.0% |
| Spanish Americans | 97.9 /100 | #105 | Exceptional 9.1% |
| Laotians | 97.8 /100 | #106 | Exceptional 9.1% |
| Hispanics or Latinos | 97.7 /100 | #107 | Exceptional 9.1% |
| Mexican American Indians | 97.6 /100 | #108 | Exceptional 9.1% |
| Maltese | 97.6 /100 | #109 | Exceptional 9.1% |
| Delaware | 97.2 /100 | #110 | Exceptional 9.2% |
| Immigrants | Kuwait | 95.1 /100 | #111 | Exceptional 9.4% |
| Armenians | 95.0 /100 | #112 | Exceptional 9.4% |
| Immigrants | Netherlands | 94.8 /100 | #113 | Exceptional 9.4% |
| Serbians | 94.3 /100 | #114 | Exceptional 9.4% |
| Navajo | 94.2 /100 | #115 | Exceptional 9.4% |