Arapaho vs Immigrants from Guatemala Unemployment Among Ages 35 to 44 years

COMPARE

Arapaho
Race
Ancestry
AfghanAfricanAlaska NativeAlaskan AthabascanAlbanianAleutAlsatianAmericanApacheArabArapahoArgentineanArmenianAssyrian/Chaldean/SyriacAustralianAustrianBahamianBangladeshiBarbadianBasqueBelgianBelizeanBermudanBhutaneseBlackfeetBolivianBrazilianBritishBritish West IndianBulgarianBurmeseCajunCambodianCanadianCape VerdeanCarpatho RusynCelticCentral AmericanCentral American IndianCherokeeCheyenneChickasawChileanChineseChippewaChoctawColombianColvilleComancheCosta RicanCreeCreekCroatianCrowCubanCypriotCzechCzechoslovakianDanishDelawareDominicanDutchDutch West IndianEastern EuropeanEcuadorianEgyptianEnglishEstonianEthiopianEuropeanFijianFilipinoFinnishFrenchFrench American IndianFrench CanadianGermanGerman RussianGhanaianGreekGuamanian/ChamorroGuatemalanGuyaneseHaitianHmongHonduranHopiHoumaHungarianIcelanderIndian (Asian)IndonesianInupiatIranianIraqiIrishIroquoisIsraeliItalianJamaicanJapaneseJordanianKenyanKiowaKoreanLaotianLatvianLebaneseLiberianLithuanianLumbeeLuxembourgerMacedonianMalaysianMalteseMarshalleseMenomineeMexicanMexican American IndianMongolianMoroccanNative HawaiianNavajoNepaleseNew ZealanderNicaraguanNigerianNorthern EuropeanNorwegianOkinawanOsageOttawaPaiutePakistaniPalestinianPanamanianParaguayanPennsylvania GermanPeruvianPimaPolishPortuguesePotawatomiPuebloPuerto RicanPuget Sound SalishRomanianRussianSalvadoranSamoanScandinavianScotch-IrishScottishSeminoleSenegaleseSerbianShoshoneSierra LeoneanSiouxSlavicSlovakSloveneSomaliSouth AfricanSouth AmericanSouth American IndianSoviet UnionSpaniardSpanishSpanish AmericanSpanish American IndianSri LankanSubsaharan AfricanSudaneseSwedishSwissSyrianTaiwaneseThaiTlingit-HaidaTohono O'OdhamTonganTrinidadian and TobagonianTsimshianTurkishU.S. Virgin IslanderUgandanUkrainianUruguayanUteVenezuelanVietnameseWelshWest IndianYakamaYaquiYugoslavianYumanYup'ikZimbabwean
Immigration
NonimmigrantsImmigrantsAfghanistanAfricaAlbaniaArgentinaArmeniaAsiaAustraliaAustriaBahamasBangladeshBarbadosBelarusBelgiumBelizeBoliviaBosnia and HerzegovinaBrazilBulgariaBurma/MyanmarCabo VerdeCambodiaCameroonCanadaCaribbeanCentral AmericaChileChinaColombiaCongoCosta RicaCroatiaCubaCzechoslovakiaDenmarkDominicaDominican RepublicEastern AfricaEastern AsiaEastern EuropeEcuadorEgyptEl SalvadorEnglandEritreaEthiopiaEuropeFijiFranceGermanyGhanaGreeceGrenadaGuyanaHaitiHondurasHong KongHungaryIndiaIndonesiaIranIraqIrelandIsraelItalyJamaicaJapanJordanKazakhstanKenyaKoreaKuwaitLaosLatin AmericaLatviaLebanonLiberiaLithuaniaMalaysiaMexicoMicronesiaMiddle AfricaMoldovaMoroccoNepalNetherlandsNicaraguaNigeriaNorth AmericaNorth MacedoniaNorthern AfricaNorthern EuropeNorwayOceaniaPakistanPanamaPeruPhilippinesPolandPortugalRomaniaRussiaSaudi ArabiaScotlandSenegalSerbiaSierra LeoneSingaporeSomaliaSouth AfricaSouth AmericaSouth Central AsiaSouth Eastern AsiaSouthern EuropeSpainSri LankaSt. Vincent and the GrenadinesSudanSwedenSwitzerlandSyriaTaiwanThailandTrinidad and TobagoTurkeyUgandaUkraineUruguayUzbekistanVenezuelaVietnamWest IndiesWestern AfricaWestern AsiaWestern EuropeYemenZaireZimbabweAzores
Immigrants from Guatemala
Race
Ancestry
AfghanAfricanAlaska NativeAlaskan AthabascanAlbanianAleutAlsatianAmericanApacheArabArgentineanArmenianAssyrian/Chaldean/SyriacAustralianAustrianBahamianBangladeshiBarbadianBasqueBelgianBelizeanBermudanBhutaneseBlackfeetBolivianBrazilianBritishBritish West IndianBulgarianBurmeseCajunCambodianCanadianCape VerdeanCarpatho RusynCelticCentral AmericanCentral American IndianCherokeeCheyenneChickasawChileanChineseChippewaChoctawColombianColvilleComancheCosta RicanCreeCreekCroatianCrowCubanCypriotCzechCzechoslovakianDanishDelawareDominicanDutchDutch West IndianEastern EuropeanEcuadorianEgyptianEnglishEstonianEthiopianEuropeanFijianFilipinoFinnishFrenchFrench American IndianFrench CanadianGermanGerman RussianGhanaianGreekGuamanian/ChamorroGuatemalanGuyaneseHaitianHmongHonduranHopiHoumaHungarianIcelanderIndian (Asian)IndonesianInupiatIranianIraqiIrishIroquoisIsraeliItalianJamaicanJapaneseJordanianKenyanKiowaKoreanLaotianLatvianLebaneseLiberianLithuanianLumbeeLuxembourgerMacedonianMalaysianMalteseMarshalleseMenomineeMexicanMexican American IndianMongolianMoroccanNative HawaiianNavajoNepaleseNew ZealanderNicaraguanNigerianNorthern EuropeanNorwegianOkinawanOsageOttawaPaiutePakistaniPalestinianPanamanianParaguayanPennsylvania GermanPeruvianPimaPolishPortuguesePotawatomiPuebloPuerto RicanPuget Sound SalishRomanianRussianSalvadoranSamoanScandinavianScotch-IrishScottishSeminoleSenegaleseSerbianShoshoneSierra LeoneanSiouxSlavicSlovakSloveneSomaliSouth AfricanSouth AmericanSouth American IndianSoviet UnionSpaniardSpanishSpanish AmericanSpanish American IndianSri LankanSubsaharan AfricanSudaneseSwedishSwissSyrianTaiwaneseThaiTlingit-HaidaTohono O'OdhamTonganTrinidadian and TobagonianTsimshianTurkishU.S. Virgin IslanderUgandanUkrainianUruguayanUteVenezuelanVietnameseWelshWest IndianYakamaYaquiYugoslavianYumanYup'ikZimbabwean
Immigration
NonimmigrantsImmigrantsAfghanistanAfricaAlbaniaArgentinaArmeniaAsiaAustraliaAustriaBahamasBangladeshBarbadosBelarusBelgiumBelizeBoliviaBosnia and HerzegovinaBrazilBulgariaBurma/MyanmarCabo VerdeCambodiaCameroonCanadaCaribbeanCentral AmericaChileChinaColombiaCongoCosta RicaCroatiaCubaCzechoslovakiaDenmarkDominicaDominican RepublicEastern AfricaEastern AsiaEastern EuropeEcuadorEgyptEl SalvadorEnglandEritreaEthiopiaEuropeFijiFranceGermanyGhanaGreeceGrenadaGuatemalaGuyanaHaitiHondurasHong KongHungaryIndiaIndonesiaIranIraqIrelandIsraelItalyJamaicaJapanJordanKazakhstanKenyaKoreaKuwaitLaosLatin AmericaLatviaLebanonLiberiaLithuaniaMalaysiaMexicoMicronesiaMiddle AfricaMoldovaMoroccoNepalNetherlandsNicaraguaNigeriaNorth AmericaNorth MacedoniaNorthern AfricaNorthern EuropeNorwayOceaniaPakistanPanamaPeruPhilippinesPolandPortugalRomaniaRussiaSaudi ArabiaScotlandSenegalSerbiaSierra LeoneSingaporeSomaliaSouth AfricaSouth AmericaSouth Central AsiaSouth Eastern AsiaSouthern EuropeSpainSri LankaSt. Vincent and the GrenadinesSudanSwedenSwitzerlandSyriaTaiwanThailandTrinidad and TobagoTurkeyUgandaUkraineUruguayUzbekistanVenezuelaVietnamWest IndiesWestern AfricaWestern AsiaWestern EuropeYemenZaireZimbabweAzores
Unemployment Among Ages 35 to 44 years
Income
Poverty
Unemployment
Labor Participation
Family Structure
Vehicle Availability
Education Level
Disability

Unemployment Among Ages 35 to 44 years Comparison

Arapaho

Immigrants from Guatemala

Tragic
Tragic
10.3%
UNEMPLOYMENT AMONG AGES 35 TO 44 YEARS
0.0/ 100
METRIC RATING
343rd/ 347
METRIC RANK
5.2%
UNEMPLOYMENT AMONG AGES 35 TO 44 YEARS
0.4/ 100
METRIC RATING
246th/ 347
METRIC RANK

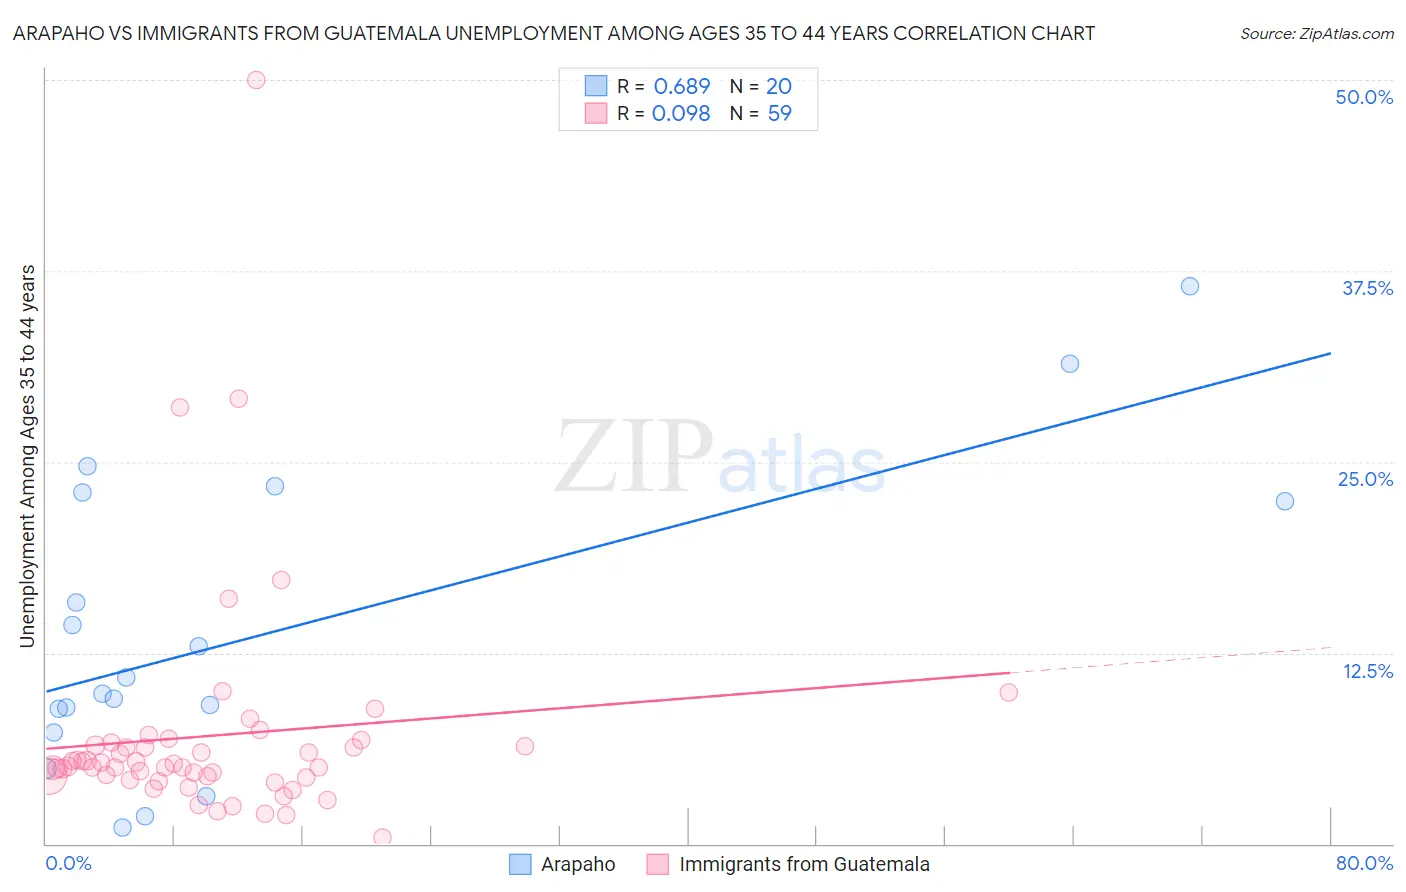
Arapaho vs Immigrants from Guatemala Unemployment Among Ages 35 to 44 years Correlation Chart

The statistical analysis conducted on geographies consisting of 29,560,765 people shows a significant positive correlation between the proportion of Arapaho and unemployment rate among population between the ages 35 and 44 in the United States with a correlation coefficient (R) of 0.689 and weighted average of 10.3%. Similarly, the statistical analysis conducted on geographies consisting of 370,619,643 people shows a slight positive correlation between the proportion of Immigrants from Guatemala and unemployment rate among population between the ages 35 and 44 in the United States with a correlation coefficient (R) of 0.098 and weighted average of 5.2%, a difference of 99.6%.
Arapaho vs Immigrants from Guatemala Unemployment Among Ages 35 to 44 years

Unemployment Among Ages 35 to 44 years Correlation Summary

MeasurementArapahoImmigrants from Guatemala
Minimum1.1%0.40%
Maximum36.5%50.0%
Range35.4%49.6%
Mean14.0%7.1%
Median10.3%5.0%
Interquartile 25% (IQ1)8.1%4.3%
Interquartile 75% (IQ3)22.7%6.4%
Interquartile Range (IQR)14.7%2.1%
Standard Deviation (Sample)9.9%7.6%
Standard Deviation (Population)9.6%7.6%

Similar Demographics by Unemployment Among Ages 35 to 44 years

Demographics Similar to Arapaho by Unemployment Among Ages 35 to 44 years

In terms of unemployment among ages 35 to 44 years, the demographic groups most similar to Arapaho are Navajo (9.3%, a difference of 10.2%), Pima (11.8%, a difference of 14.3%), Hopi (8.9%, a difference of 15.8%), Alaskan Athabascan (8.6%, a difference of 19.2%), and Inupiat (8.6%, a difference of 20.0%).
DemographicsRating | RankUnemployment Among Ages 35 to 44 years
Puerto Ricans
0.0
/100
|
#333
Tragic
7.6%
Houma
0.0
/100
|
#334
Tragic
7.8%
Sioux
0.0
/100
|
#335
Tragic
8.4%
Apache
0.0
/100
|
#336
Tragic
8.4%
Tohono O'odham
0.0
/100
|
#337
Tragic
8.4%
Cheyenne
0.0
/100
|
#338
Tragic
8.5%
Inupiat
0.0
/100
|
#339
Tragic
8.6%
Alaskan Athabascans
0.0
/100
|
#340
Tragic
8.6%
Hopi
0.0
/100
|
#341
Tragic
8.9%
Navajo
0.0
/100
|
#342
Tragic
9.3%
Arapaho
0.0
/100
|
#343
Tragic
10.3%
Pima
0.0
/100
|
#344
Tragic
11.8%
Yup'ik
0.0
/100
|
#345
Tragic
14.4%
Crow
0.0
/100
|
#346
Tragic
15.7%
Yuman
0.0
/100
|
#347
Tragic
16.9%

Demographics Similar to Immigrants from Guatemala by Unemployment Among Ages 35 to 44 years

In terms of unemployment among ages 35 to 44 years, the demographic groups most similar to Immigrants from Guatemala are Bahamian (5.2%, a difference of 0.0%), Immigrants from Somalia (5.2%, a difference of 0.16%), Salvadoran (5.1%, a difference of 0.26%), Guatemalan (5.1%, a difference of 0.26%), and Delaware (5.1%, a difference of 0.38%).
DemographicsRating | RankUnemployment Among Ages 35 to 44 years
Nigerians
0.7
/100
|
#239
Tragic
5.1%
Somalis
0.7
/100
|
#240
Tragic
5.1%
Immigrants | Honduras
0.6
/100
|
#241
Tragic
5.1%
Delaware
0.5
/100
|
#242
Tragic
5.1%
Salvadorans
0.4
/100
|
#243
Tragic
5.1%
Guatemalans
0.4
/100
|
#244
Tragic
5.1%
Bahamians
0.4
/100
|
#245
Tragic
5.2%
Immigrants | Guatemala
0.4
/100
|
#246
Tragic
5.2%
Immigrants | Somalia
0.3
/100
|
#247
Tragic
5.2%
Alsatians
0.2
/100
|
#248
Tragic
5.2%
Immigrants | Liberia
0.2
/100
|
#249
Tragic
5.2%
Immigrants | El Salvador
0.2
/100
|
#250
Tragic
5.2%
Comanche
0.2
/100
|
#251
Tragic
5.2%
Armenians
0.2
/100
|
#252
Tragic
5.2%
Mexican American Indians
0.2
/100
|
#253
Tragic
5.2%