Arapaho vs Immigrants from England Average Family Size
COMPARE
Arapaho
Immigrants from England
Average Family Size
Average Family Size Comparison
Arapaho
Immigrants from England
3.64
AVERAGE FAMILY SIZE
100.0/ 100
METRIC RATING
6th/ 347
METRIC RANK
3.15
AVERAGE FAMILY SIZE
0.4/ 100
METRIC RATING
280th/ 347
METRIC RANK
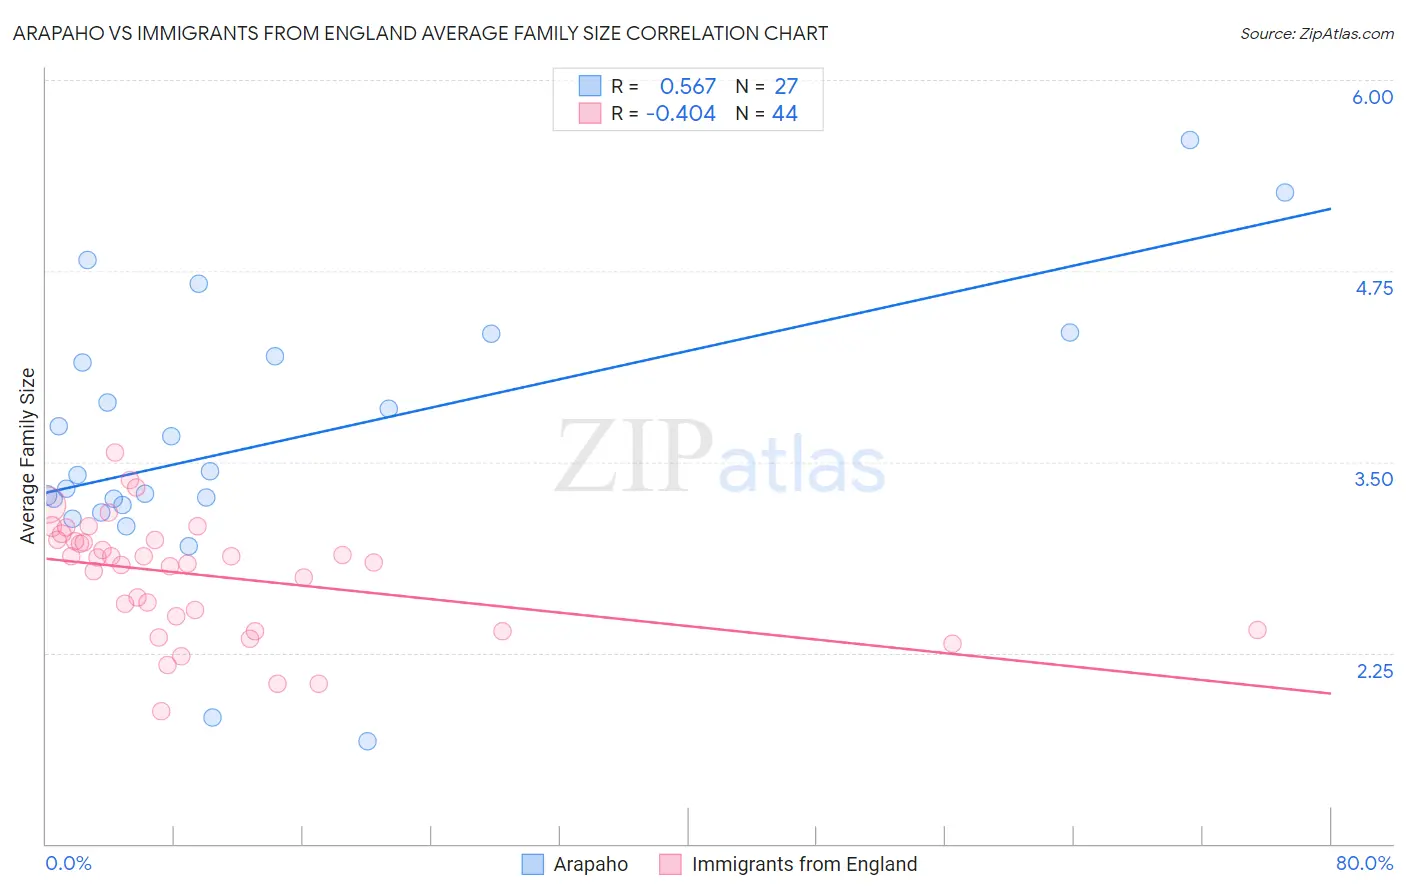
Arapaho vs Immigrants from England Average Family Size Correlation Chart
The statistical analysis conducted on geographies consisting of 29,778,233 people shows a substantial positive correlation between the proportion of Arapaho and average family size in the United States with a correlation coefficient (R) of 0.567 and weighted average of 3.64. Similarly, the statistical analysis conducted on geographies consisting of 391,752,493 people shows a moderate negative correlation between the proportion of Immigrants from England and average family size in the United States with a correlation coefficient (R) of -0.404 and weighted average of 3.15, a difference of 15.5%.
Average Family Size Correlation Summary
| Measurement | Arapaho | Immigrants from England |
| Minimum | 1.67 | 1.87 |
| Maximum | 5.61 | 3.56 |
| Range | 3.94 | 1.69 |
| Mean | 3.63 | 2.76 |
| Median | 3.42 | 2.86 |
| Interquartile 25% (IQ1) | 3.22 | 2.45 |
| Interquartile 75% (IQ3) | 4.19 | 2.99 |
| Interquartile Range (IQR) | 0.97 | 0.54 |
| Standard Deviation (Sample) | 0.88 | 0.38 |
| Standard Deviation (Population) | 0.86 | 0.37 |
Similar Demographics by Average Family Size
Demographics Similar to Arapaho by Average Family Size
In terms of average family size, the demographic groups most similar to Arapaho are Inupiat (3.63, a difference of 0.22%), Navajo (3.65, a difference of 0.27%), Immigrants from Yemen (3.60, a difference of 1.1%), Hopi (3.60, a difference of 1.1%), and Spanish American Indian (3.58, a difference of 1.4%).
| Demographics | Rating | Rank | Average Family Size |
| Yup'ik | 100 /100 | #1 | Exceptional 4.00 |
| Crow | 100 /100 | #2 | Exceptional 3.82 |
| Pueblo | 100 /100 | #3 | Exceptional 3.79 |
| Pima | 100 /100 | #4 | Exceptional 3.75 |
| Navajo | 100.0 /100 | #5 | Exceptional 3.65 |
| Arapaho | 100.0 /100 | #6 | Exceptional 3.64 |
| Inupiat | 100.0 /100 | #7 | Exceptional 3.63 |
| Immigrants | Yemen | 100.0 /100 | #8 | Exceptional 3.60 |
| Hopi | 100.0 /100 | #9 | Exceptional 3.60 |
| Spanish American Indians | 100.0 /100 | #10 | Exceptional 3.58 |
| Tohono O'odham | 100.0 /100 | #11 | Exceptional 3.53 |
| Immigrants | Mexico | 100.0 /100 | #12 | Exceptional 3.52 |
| Sioux | 100.0 /100 | #13 | Exceptional 3.52 |
| Immigrants | Central America | 100.0 /100 | #14 | Exceptional 3.49 |
| Tongans | 100.0 /100 | #15 | Exceptional 3.49 |
Demographics Similar to Immigrants from England by Average Family Size
In terms of average family size, the demographic groups most similar to Immigrants from England are Immigrants from Europe (3.15, a difference of 0.030%), Okinawan (3.15, a difference of 0.040%), Immigrants from Denmark (3.15, a difference of 0.040%), Yugoslavian (3.15, a difference of 0.040%), and German Russian (3.15, a difference of 0.060%).
| Demographics | Rating | Rank | Average Family Size |
| New Zealanders | 0.6 /100 | #273 | Tragic 3.15 |
| Immigrants | Belgium | 0.6 /100 | #274 | Tragic 3.15 |
| Cambodians | 0.6 /100 | #275 | Tragic 3.15 |
| Immigrants | Bosnia and Herzegovina | 0.5 /100 | #276 | Tragic 3.15 |
| Swiss | 0.5 /100 | #277 | Tragic 3.15 |
| Okinawans | 0.5 /100 | #278 | Tragic 3.15 |
| Immigrants | Europe | 0.5 /100 | #279 | Tragic 3.15 |
| Immigrants | England | 0.4 /100 | #280 | Tragic 3.15 |
| Immigrants | Denmark | 0.4 /100 | #281 | Tragic 3.15 |
| Yugoslavians | 0.4 /100 | #282 | Tragic 3.15 |
| German Russians | 0.4 /100 | #283 | Tragic 3.15 |
| Immigrants | France | 0.4 /100 | #284 | Tragic 3.15 |
| Whites/Caucasians | 0.3 /100 | #285 | Tragic 3.14 |
| Immigrants | Netherlands | 0.3 /100 | #286 | Tragic 3.14 |
| Greeks | 0.3 /100 | #287 | Tragic 3.14 |