Arab vs Immigrants from Guatemala Median Male Earnings
COMPARE
Arab
Immigrants from Guatemala
Median Male Earnings
Median Male Earnings Comparison
Arabs
Immigrants from Guatemala
$57,298
MEDIAN MALE EARNINGS
94.0/ 100
METRIC RATING
119th/ 347
METRIC RANK
$46,244
MEDIAN MALE EARNINGS
0.0/ 100
METRIC RATING
315th/ 347
METRIC RANK
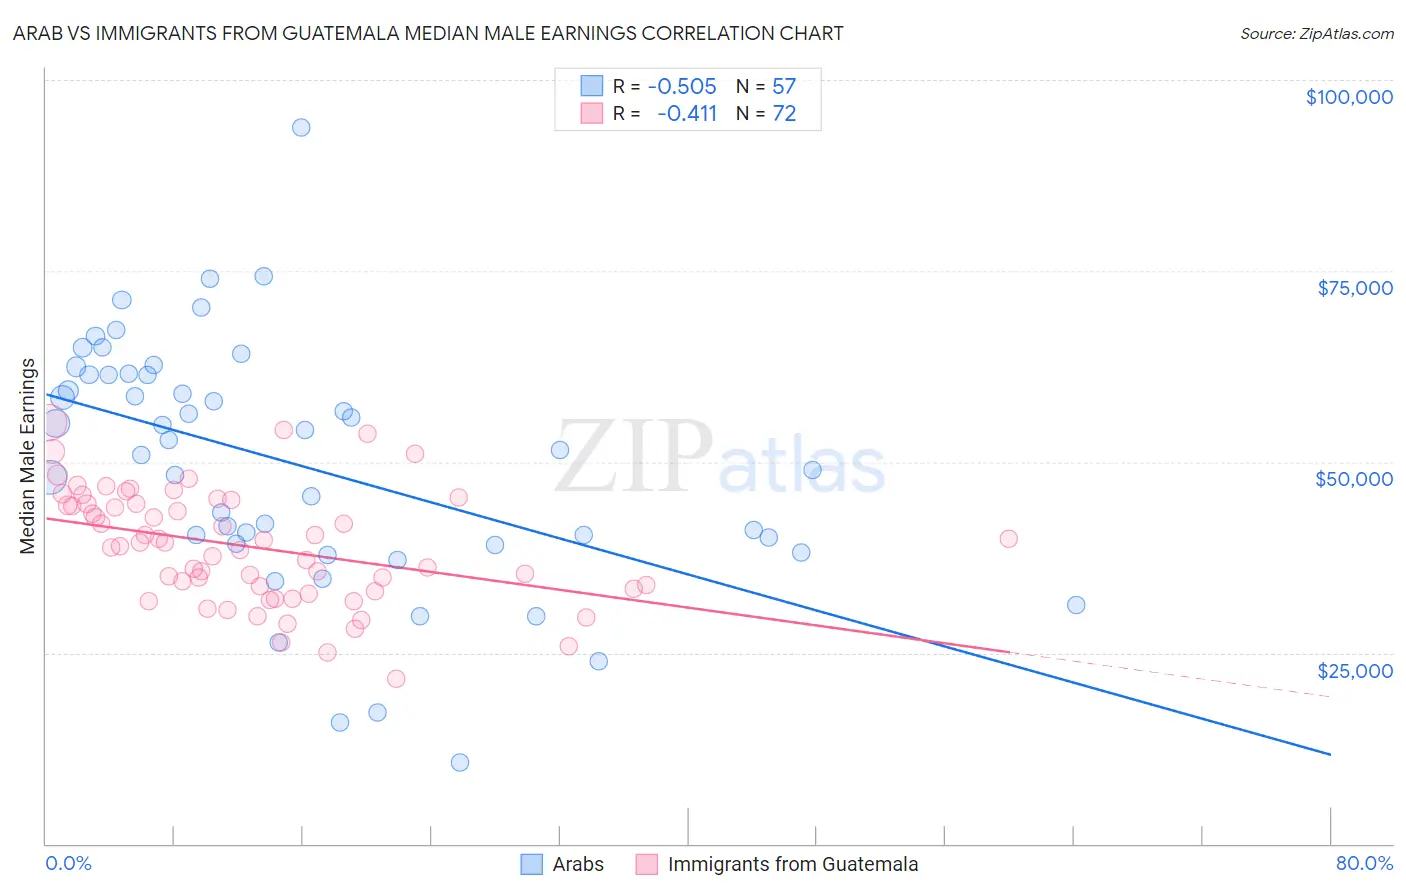
Arab vs Immigrants from Guatemala Median Male Earnings Correlation Chart
The statistical analysis conducted on geographies consisting of 486,638,501 people shows a substantial negative correlation between the proportion of Arabs and median male earnings in the United States with a correlation coefficient (R) of -0.505 and weighted average of $57,298. Similarly, the statistical analysis conducted on geographies consisting of 377,185,627 people shows a moderate negative correlation between the proportion of Immigrants from Guatemala and median male earnings in the United States with a correlation coefficient (R) of -0.411 and weighted average of $46,244, a difference of 23.9%.
Median Male Earnings Correlation Summary
| Measurement | Arab | Immigrants from Guatemala |
| Minimum | $10,662 | $21,641 |
| Maximum | $93,845 | $55,102 |
| Range | $83,183 | $33,461 |
| Mean | $49,636 | $38,841 |
| Median | $51,622 | $39,223 |
| Interquartile 25% (IQ1) | $39,178 | $33,223 |
| Interquartile 75% (IQ3) | $61,412 | $44,533 |
| Interquartile Range (IQR) | $22,233 | $11,310 |
| Standard Deviation (Sample) | $16,136 | $7,423 |
| Standard Deviation (Population) | $15,994 | $7,371 |
Similar Demographics by Median Male Earnings
Demographics Similar to Arabs by Median Male Earnings
In terms of median male earnings, the demographic groups most similar to Arabs are Hungarian ($57,309, a difference of 0.020%), Canadian ($57,286, a difference of 0.020%), Immigrants from Zimbabwe ($57,352, a difference of 0.090%), Lebanese ($57,409, a difference of 0.19%), and Immigrants from Albania ($57,179, a difference of 0.21%).
| Demographics | Rating | Rank | Median Male Earnings |
| Immigrants | Afghanistan | 95.4 /100 | #112 | Exceptional $57,582 |
| Carpatho Rusyns | 95.3 /100 | #113 | Exceptional $57,572 |
| Immigrants | Kuwait | 95.3 /100 | #114 | Exceptional $57,562 |
| Swedes | 94.8 /100 | #115 | Exceptional $57,445 |
| Lebanese | 94.6 /100 | #116 | Exceptional $57,409 |
| Immigrants | Zimbabwe | 94.3 /100 | #117 | Exceptional $57,352 |
| Hungarians | 94.0 /100 | #118 | Exceptional $57,309 |
| Arabs | 94.0 /100 | #119 | Exceptional $57,298 |
| Canadians | 93.9 /100 | #120 | Exceptional $57,286 |
| Immigrants | Albania | 93.3 /100 | #121 | Exceptional $57,179 |
| Immigrants | Jordan | 93.1 /100 | #122 | Exceptional $57,145 |
| Slovenes | 93.1 /100 | #123 | Exceptional $57,145 |
| Chileans | 91.9 /100 | #124 | Exceptional $56,973 |
| Immigrants | Morocco | 91.8 /100 | #125 | Exceptional $56,958 |
| Chinese | 91.1 /100 | #126 | Exceptional $56,872 |
Demographics Similar to Immigrants from Guatemala by Median Male Earnings
In terms of median male earnings, the demographic groups most similar to Immigrants from Guatemala are Immigrants from Caribbean ($46,193, a difference of 0.11%), Mexican ($46,147, a difference of 0.21%), Chippewa ($46,368, a difference of 0.27%), Honduran ($46,374, a difference of 0.28%), and Hispanic or Latino ($46,419, a difference of 0.38%).
| Demographics | Rating | Rank | Median Male Earnings |
| Ottawa | 0.0 /100 | #308 | Tragic $46,611 |
| Creek | 0.0 /100 | #309 | Tragic $46,594 |
| Cubans | 0.0 /100 | #310 | Tragic $46,580 |
| Apache | 0.0 /100 | #311 | Tragic $46,429 |
| Hispanics or Latinos | 0.0 /100 | #312 | Tragic $46,419 |
| Hondurans | 0.0 /100 | #313 | Tragic $46,374 |
| Chippewa | 0.0 /100 | #314 | Tragic $46,368 |
| Immigrants | Guatemala | 0.0 /100 | #315 | Tragic $46,244 |
| Immigrants | Caribbean | 0.0 /100 | #316 | Tragic $46,193 |
| Mexicans | 0.0 /100 | #317 | Tragic $46,147 |
| Cheyenne | 0.0 /100 | #318 | Tragic $46,062 |
| Haitians | 0.0 /100 | #319 | Tragic $45,903 |
| Immigrants | Honduras | 0.0 /100 | #320 | Tragic $45,787 |
| Fijians | 0.0 /100 | #321 | Tragic $45,607 |
| Sioux | 0.0 /100 | #322 | Tragic $45,566 |