Belgian vs British West Indian Median Female Earnings
COMPARE
Belgian
British West Indian
Median Female Earnings
Median Female Earnings Comparison
Belgians
British West Indians
$38,382
MEDIAN FEMALE EARNINGS
6.1/ 100
METRIC RATING
229th/ 347
METRIC RANK
$40,299
MEDIAN FEMALE EARNINGS
77.7/ 100
METRIC RATING
153rd/ 347
METRIC RANK
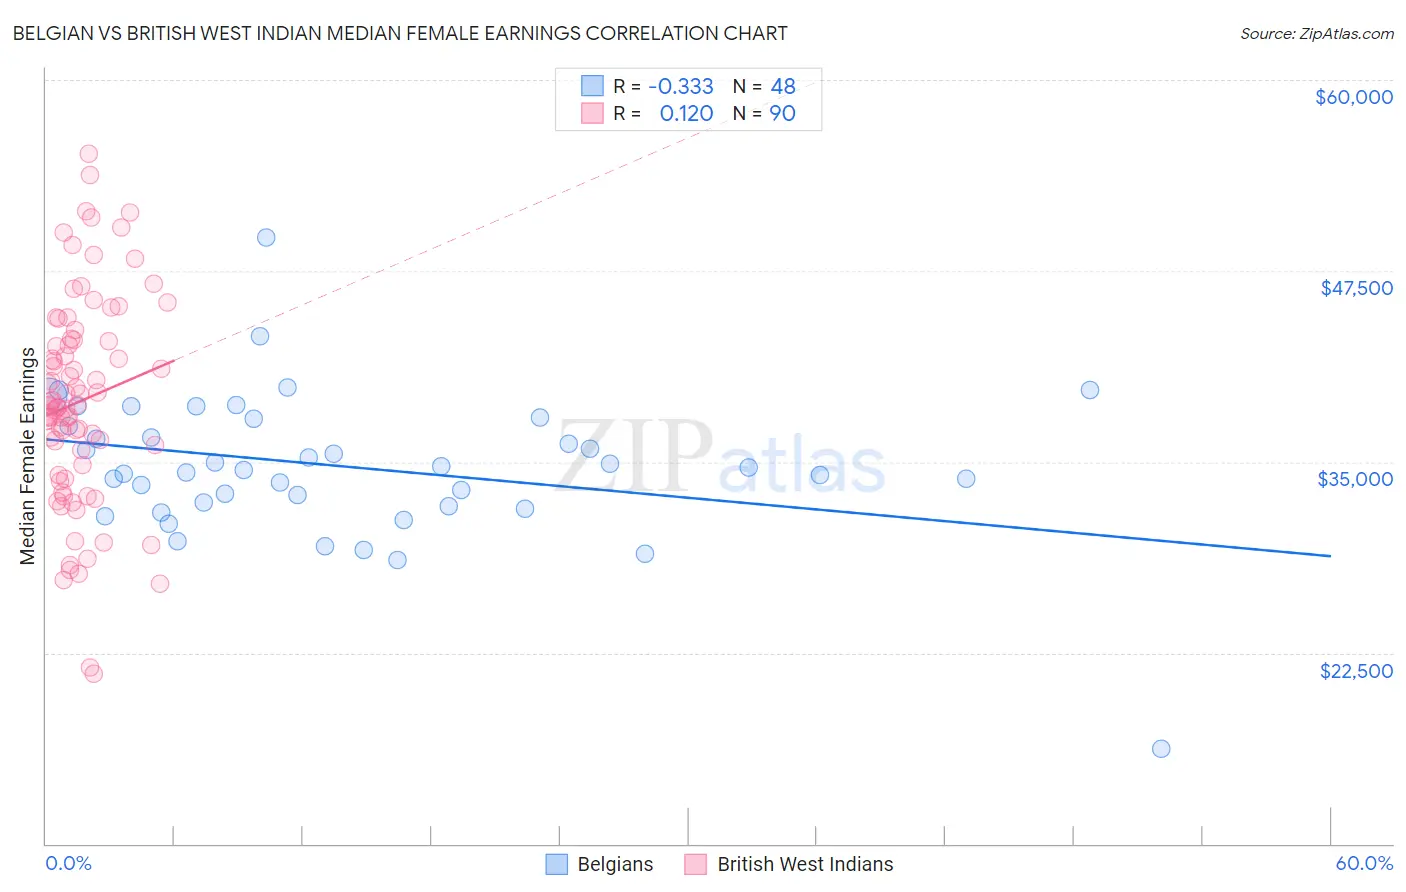
Belgian vs British West Indian Median Female Earnings Correlation Chart
The statistical analysis conducted on geographies consisting of 355,862,311 people shows a mild negative correlation between the proportion of Belgians and median female earnings in the United States with a correlation coefficient (R) of -0.333 and weighted average of $38,382. Similarly, the statistical analysis conducted on geographies consisting of 152,687,488 people shows a poor positive correlation between the proportion of British West Indians and median female earnings in the United States with a correlation coefficient (R) of 0.120 and weighted average of $40,299, a difference of 5.0%.
Median Female Earnings Correlation Summary
| Measurement | Belgian | British West Indian |
| Minimum | $16,250 | $21,143 |
| Maximum | $49,724 | $55,209 |
| Range | $33,474 | $34,066 |
| Mean | $34,687 | $38,959 |
| Median | $34,563 | $38,706 |
| Interquartile 25% (IQ1) | $32,227 | $34,766 |
| Interquartile 75% (IQ3) | $37,577 | $42,968 |
| Interquartile Range (IQR) | $5,350 | $8,202 |
| Standard Deviation (Sample) | $4,773 | $6,842 |
| Standard Deviation (Population) | $4,723 | $6,804 |
Similar Demographics by Median Female Earnings
Demographics Similar to Belgians by Median Female Earnings
In terms of median female earnings, the demographic groups most similar to Belgians are Subsaharan African ($38,391, a difference of 0.020%), Scottish ($38,397, a difference of 0.040%), Basque ($38,352, a difference of 0.080%), Somali ($38,333, a difference of 0.13%), and French Canadian ($38,436, a difference of 0.14%).
| Demographics | Rating | Rank | Median Female Earnings |
| Japanese | 8.1 /100 | #222 | Tragic $38,528 |
| Immigrants | Sudan | 7.8 /100 | #223 | Tragic $38,511 |
| Native Hawaiians | 7.1 /100 | #224 | Tragic $38,461 |
| French | 7.0 /100 | #225 | Tragic $38,457 |
| French Canadians | 6.8 /100 | #226 | Tragic $38,436 |
| Scottish | 6.3 /100 | #227 | Tragic $38,397 |
| Sub-Saharan Africans | 6.2 /100 | #228 | Tragic $38,391 |
| Belgians | 6.1 /100 | #229 | Tragic $38,382 |
| Basques | 5.7 /100 | #230 | Tragic $38,352 |
| Somalis | 5.5 /100 | #231 | Tragic $38,333 |
| Scandinavians | 5.2 /100 | #232 | Tragic $38,306 |
| Tongans | 5.1 /100 | #233 | Tragic $38,288 |
| Celtics | 5.0 /100 | #234 | Tragic $38,283 |
| Sudanese | 4.4 /100 | #235 | Tragic $38,215 |
| Liberians | 4.4 /100 | #236 | Tragic $38,215 |
Demographics Similar to British West Indians by Median Female Earnings
In terms of median female earnings, the demographic groups most similar to British West Indians are Immigrants from Oceania ($40,297, a difference of 0.010%), West Indian ($40,317, a difference of 0.040%), Immigrants from Armenia ($40,340, a difference of 0.10%), Immigrants from Africa ($40,257, a difference of 0.10%), and Immigrants from Chile ($40,353, a difference of 0.13%).
| Demographics | Rating | Rank | Median Female Earnings |
| Ghanaians | 82.1 /100 | #146 | Excellent $40,429 |
| Vietnamese | 80.4 /100 | #147 | Excellent $40,377 |
| Poles | 80.2 /100 | #148 | Excellent $40,371 |
| Immigrants | Cameroon | 79.7 /100 | #149 | Good $40,354 |
| Immigrants | Chile | 79.6 /100 | #150 | Good $40,353 |
| Immigrants | Armenia | 79.2 /100 | #151 | Good $40,340 |
| West Indians | 78.4 /100 | #152 | Good $40,317 |
| British West Indians | 77.7 /100 | #153 | Good $40,299 |
| Immigrants | Oceania | 77.6 /100 | #154 | Good $40,297 |
| Immigrants | Africa | 76.2 /100 | #155 | Good $40,257 |
| Peruvians | 75.3 /100 | #156 | Good $40,234 |
| Portuguese | 73.0 /100 | #157 | Good $40,177 |
| Immigrants | Senegal | 72.2 /100 | #158 | Good $40,157 |
| Immigrants | Vietnam | 72.0 /100 | #159 | Good $40,153 |
| Inupiat | 68.9 /100 | #160 | Good $40,080 |