Cape Verdean vs Immigrants from Barbados Per Capita Income
COMPARE
Cape Verdean
Immigrants from Barbados
Per Capita Income
Per Capita Income Comparison
Cape Verdeans
Immigrants from Barbados
$39,935
PER CAPITA INCOME
1.5/ 100
METRIC RATING
248th/ 347
METRIC RANK
$41,478
PER CAPITA INCOME
7.9/ 100
METRIC RATING
220th/ 347
METRIC RANK
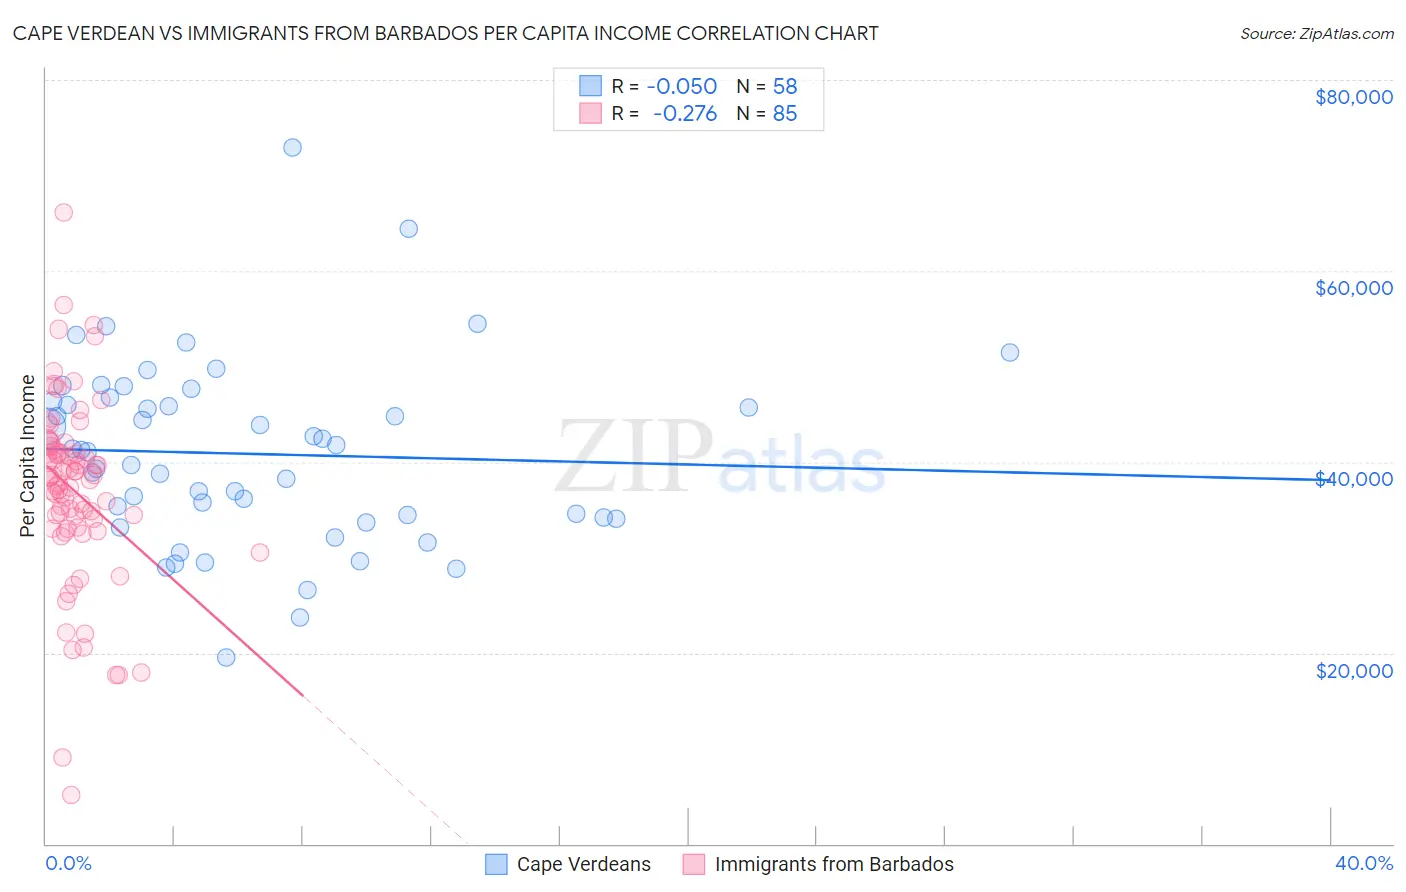
Cape Verdean vs Immigrants from Barbados Per Capita Income Correlation Chart
The statistical analysis conducted on geographies consisting of 107,581,213 people shows no correlation between the proportion of Cape Verdeans and per capita income in the United States with a correlation coefficient (R) of -0.050 and weighted average of $39,935. Similarly, the statistical analysis conducted on geographies consisting of 112,709,172 people shows a weak negative correlation between the proportion of Immigrants from Barbados and per capita income in the United States with a correlation coefficient (R) of -0.276 and weighted average of $41,478, a difference of 3.9%.
Per Capita Income Correlation Summary
| Measurement | Cape Verdean | Immigrants from Barbados |
| Minimum | $19,552 | $5,075 |
| Maximum | $72,967 | $66,187 |
| Range | $53,415 | $61,112 |
| Mean | $40,842 | $37,004 |
| Median | $41,136 | $38,335 |
| Interquartile 25% (IQ1) | $34,180 | $33,039 |
| Interquartile 75% (IQ3) | $46,319 | $41,445 |
| Interquartile Range (IQR) | $12,139 | $8,406 |
| Standard Deviation (Sample) | $9,616 | $9,798 |
| Standard Deviation (Population) | $9,533 | $9,740 |
Similar Demographics by Per Capita Income
Demographics Similar to Cape Verdeans by Per Capita Income
In terms of per capita income, the demographic groups most similar to Cape Verdeans are Immigrants from Somalia ($39,974, a difference of 0.10%), Japanese ($39,870, a difference of 0.16%), Immigrants from Burma/Myanmar ($39,827, a difference of 0.27%), Samoan ($39,826, a difference of 0.27%), and Cree ($40,056, a difference of 0.30%).
| Demographics | Rating | Rank | Per Capita Income |
| British West Indians | 2.3 /100 | #241 | Tragic $40,330 |
| Immigrants | Western Africa | 2.2 /100 | #242 | Tragic $40,294 |
| German Russians | 2.2 /100 | #243 | Tragic $40,266 |
| French American Indians | 2.1 /100 | #244 | Tragic $40,244 |
| Sub-Saharan Africans | 1.9 /100 | #245 | Tragic $40,152 |
| Cree | 1.7 /100 | #246 | Tragic $40,056 |
| Immigrants | Somalia | 1.6 /100 | #247 | Tragic $39,974 |
| Cape Verdeans | 1.5 /100 | #248 | Tragic $39,935 |
| Japanese | 1.4 /100 | #249 | Tragic $39,870 |
| Immigrants | Burma/Myanmar | 1.3 /100 | #250 | Tragic $39,827 |
| Samoans | 1.3 /100 | #251 | Tragic $39,826 |
| Immigrants | Azores | 1.0 /100 | #252 | Tragic $39,608 |
| Osage | 1.0 /100 | #253 | Tragic $39,568 |
| Alaska Natives | 1.0 /100 | #254 | Tragic $39,558 |
| Immigrants | Middle Africa | 1.0 /100 | #255 | Tragic $39,529 |
Demographics Similar to Immigrants from Barbados by Per Capita Income
In terms of per capita income, the demographic groups most similar to Immigrants from Barbados are Immigrants from Trinidad and Tobago ($41,476, a difference of 0.0%), Puget Sound Salish ($41,495, a difference of 0.040%), Immigrants from Iraq ($41,365, a difference of 0.27%), Immigrants from Cameroon ($41,334, a difference of 0.35%), and Trinidadian and Tobagonian ($41,655, a difference of 0.43%).
| Demographics | Rating | Rank | Per Capita Income |
| Immigrants | Venezuela | 10.2 /100 | #213 | Poor $41,727 |
| Immigrants | Bangladesh | 10.1 /100 | #214 | Poor $41,709 |
| Sudanese | 9.9 /100 | #215 | Tragic $41,695 |
| Tongans | 9.9 /100 | #216 | Tragic $41,693 |
| Guamanians/Chamorros | 9.7 /100 | #217 | Tragic $41,678 |
| Trinidadians and Tobagonians | 9.5 /100 | #218 | Tragic $41,655 |
| Puget Sound Salish | 8.1 /100 | #219 | Tragic $41,495 |
| Immigrants | Barbados | 7.9 /100 | #220 | Tragic $41,478 |
| Immigrants | Trinidad and Tobago | 7.9 /100 | #221 | Tragic $41,476 |
| Immigrants | Iraq | 7.1 /100 | #222 | Tragic $41,365 |
| Immigrants | Cameroon | 6.8 /100 | #223 | Tragic $41,334 |
| Immigrants | St. Vincent and the Grenadines | 6.4 /100 | #224 | Tragic $41,270 |
| West Indians | 6.0 /100 | #225 | Tragic $41,217 |
| Immigrants | Ecuador | 5.9 /100 | #226 | Tragic $41,195 |
| Immigrants | Ghana | 5.5 /100 | #227 | Tragic $41,131 |