Apache vs Kiowa Per Capita Income
COMPARE
Apache
Kiowa
Per Capita Income
Per Capita Income Comparison
Apache
Kiowa
$34,886
PER CAPITA INCOME
0.0/ 100
METRIC RATING
327th/ 347
METRIC RANK
$35,102
PER CAPITA INCOME
0.0/ 100
METRIC RATING
324th/ 347
METRIC RANK
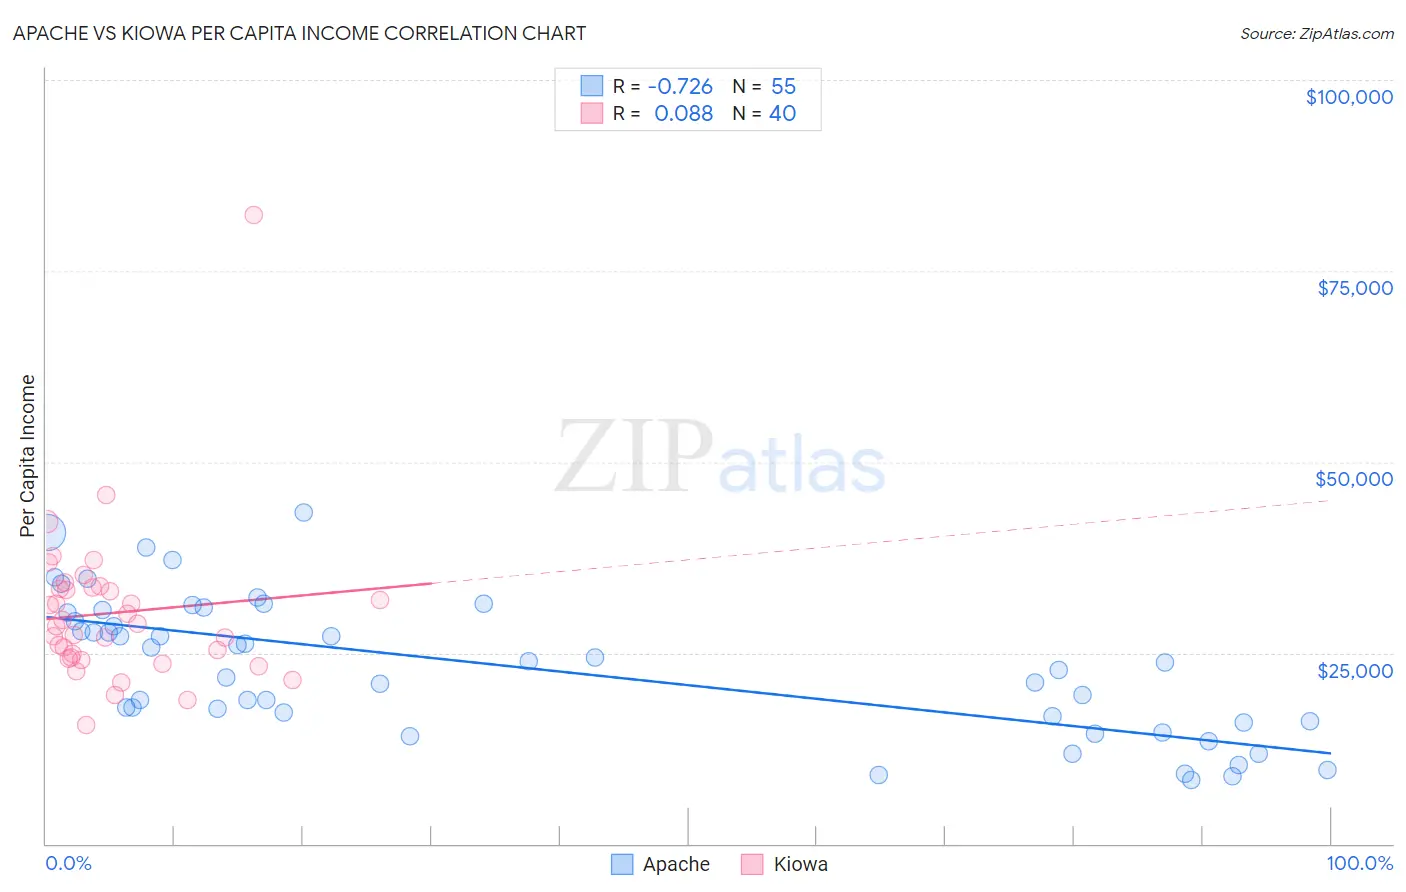
Apache vs Kiowa Per Capita Income Correlation Chart
The statistical analysis conducted on geographies consisting of 231,148,099 people shows a strong negative correlation between the proportion of Apache and per capita income in the United States with a correlation coefficient (R) of -0.726 and weighted average of $34,886. Similarly, the statistical analysis conducted on geographies consisting of 56,101,664 people shows a slight positive correlation between the proportion of Kiowa and per capita income in the United States with a correlation coefficient (R) of 0.088 and weighted average of $35,102, a difference of 0.62%.
Per Capita Income Correlation Summary
| Measurement | Apache | Kiowa |
| Minimum | $8,398 | $15,468 |
| Maximum | $43,430 | $82,387 |
| Range | $35,032 | $66,919 |
| Mean | $23,117 | $30,249 |
| Median | $23,775 | $28,572 |
| Interquartile 25% (IQ1) | $15,985 | $24,302 |
| Interquartile 75% (IQ3) | $30,233 | $33,441 |
| Interquartile Range (IQR) | $14,248 | $9,140 |
| Standard Deviation (Sample) | $8,932 | $10,578 |
| Standard Deviation (Population) | $8,851 | $10,445 |
Demographics Similar to Apache and Kiowa by Per Capita Income
In terms of per capita income, the demographic groups most similar to Apache are Immigrants from Cuba ($34,910, a difference of 0.070%), Immigrants from Central America ($34,974, a difference of 0.25%), Menominee ($34,578, a difference of 0.89%), Mexican ($34,559, a difference of 0.95%), and Cheyenne ($35,276, a difference of 1.1%). Similarly, the demographic groups most similar to Kiowa are Immigrants from Central America ($34,974, a difference of 0.37%), Cheyenne ($35,276, a difference of 0.50%), Immigrants from Cuba ($34,910, a difference of 0.55%), Creek ($35,546, a difference of 1.3%), and Black/African American ($35,564, a difference of 1.3%).
| Demographics | Rating | Rank | Per Capita Income |
| Yaqui | 0.0 /100 | #315 | Tragic $36,112 |
| Choctaw | 0.0 /100 | #316 | Tragic $35,999 |
| Dutch West Indians | 0.0 /100 | #317 | Tragic $35,922 |
| Bangladeshis | 0.0 /100 | #318 | Tragic $35,897 |
| Immigrants | Congo | 0.0 /100 | #319 | Tragic $35,720 |
| Hispanics or Latinos | 0.0 /100 | #320 | Tragic $35,688 |
| Blacks/African Americans | 0.0 /100 | #321 | Tragic $35,564 |
| Creek | 0.0 /100 | #322 | Tragic $35,546 |
| Cheyenne | 0.0 /100 | #323 | Tragic $35,276 |
| Kiowa | 0.0 /100 | #324 | Tragic $35,102 |
| Immigrants | Central America | 0.0 /100 | #325 | Tragic $34,974 |
| Immigrants | Cuba | 0.0 /100 | #326 | Tragic $34,910 |
| Apache | 0.0 /100 | #327 | Tragic $34,886 |
| Menominee | 0.0 /100 | #328 | Tragic $34,578 |
| Mexicans | 0.0 /100 | #329 | Tragic $34,559 |
| Spanish American Indians | 0.0 /100 | #330 | Tragic $34,195 |
| Immigrants | Mexico | 0.0 /100 | #331 | Tragic $33,931 |
| Sioux | 0.0 /100 | #332 | Tragic $33,921 |
| Immigrants | Yemen | 0.0 /100 | #333 | Tragic $33,696 |
| Natives/Alaskans | 0.0 /100 | #334 | Tragic $33,279 |
| Yuman | 0.0 /100 | #335 | Tragic $33,236 |