Seminole vs Immigrants from Barbados Per Capita Income
COMPARE
Seminole
Immigrants from Barbados
Per Capita Income
Per Capita Income Comparison
Seminole
Immigrants from Barbados
$36,180
PER CAPITA INCOME
0.0/ 100
METRIC RATING
314th/ 347
METRIC RANK
$41,478
PER CAPITA INCOME
7.9/ 100
METRIC RATING
220th/ 347
METRIC RANK
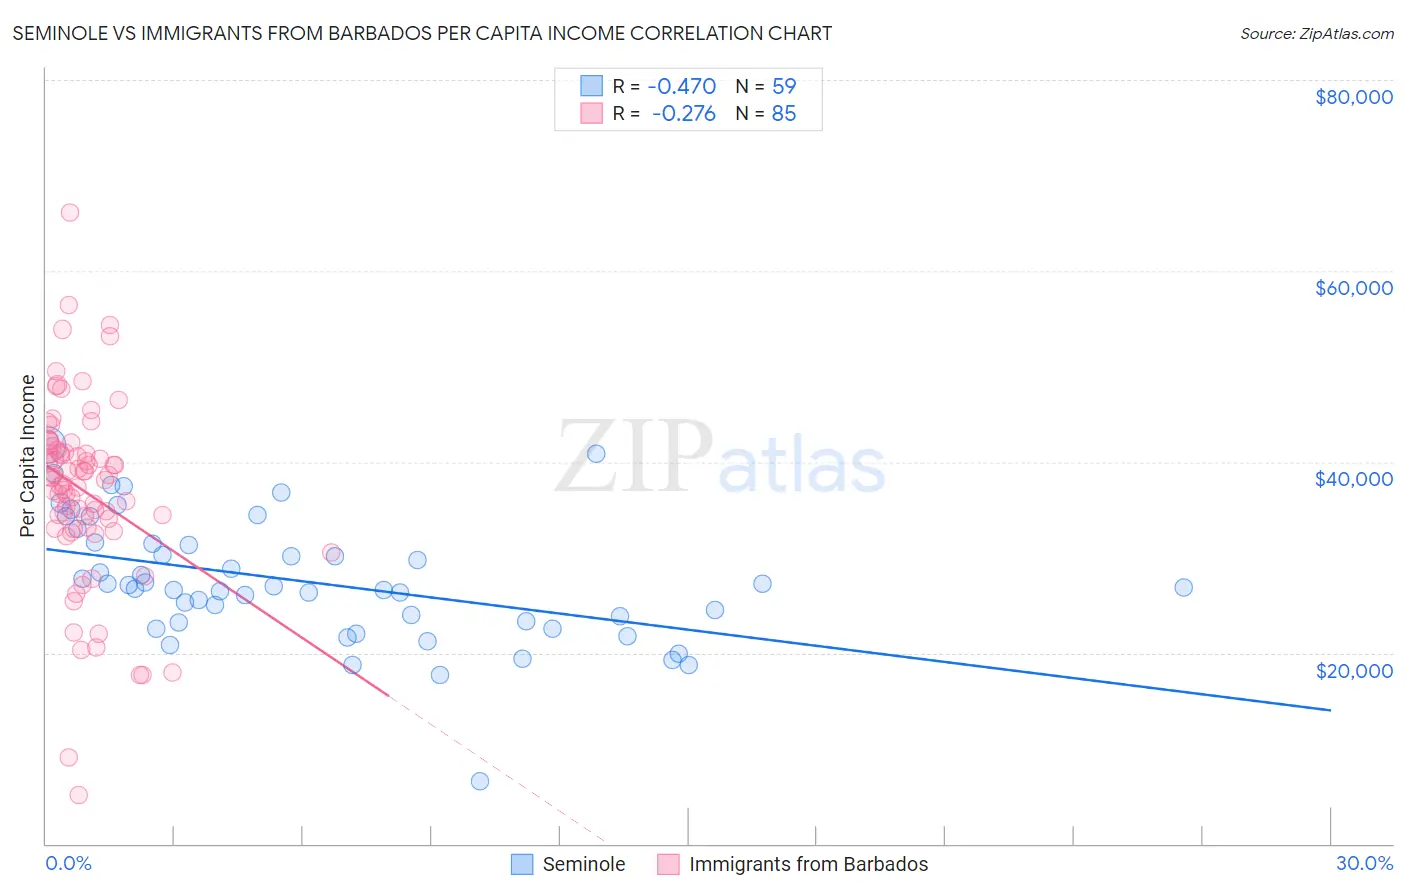
Seminole vs Immigrants from Barbados Per Capita Income Correlation Chart
The statistical analysis conducted on geographies consisting of 118,313,864 people shows a moderate negative correlation between the proportion of Seminole and per capita income in the United States with a correlation coefficient (R) of -0.470 and weighted average of $36,180. Similarly, the statistical analysis conducted on geographies consisting of 112,709,172 people shows a weak negative correlation between the proportion of Immigrants from Barbados and per capita income in the United States with a correlation coefficient (R) of -0.276 and weighted average of $41,478, a difference of 14.6%.
Per Capita Income Correlation Summary
| Measurement | Seminole | Immigrants from Barbados |
| Minimum | $6,596 | $5,075 |
| Maximum | $41,755 | $66,187 |
| Range | $35,159 | $61,112 |
| Mean | $27,427 | $37,004 |
| Median | $26,891 | $38,335 |
| Interquartile 25% (IQ1) | $23,175 | $33,039 |
| Interquartile 75% (IQ3) | $31,374 | $41,445 |
| Interquartile Range (IQR) | $8,199 | $8,406 |
| Standard Deviation (Sample) | $6,480 | $9,798 |
| Standard Deviation (Population) | $6,425 | $9,740 |
Similar Demographics by Per Capita Income
Demographics Similar to Seminole by Per Capita Income
In terms of per capita income, the demographic groups most similar to Seminole are Yaqui ($36,112, a difference of 0.19%), Choctaw ($35,999, a difference of 0.50%), Bahamian ($36,427, a difference of 0.68%), Dutch West Indian ($35,922, a difference of 0.72%), and Bangladeshi ($35,897, a difference of 0.79%).
| Demographics | Rating | Rank | Per Capita Income |
| Immigrants | Latin America | 0.0 /100 | #307 | Tragic $36,823 |
| Fijians | 0.0 /100 | #308 | Tragic $36,690 |
| Immigrants | Honduras | 0.0 /100 | #309 | Tragic $36,665 |
| Ute | 0.0 /100 | #310 | Tragic $36,651 |
| Chippewa | 0.0 /100 | #311 | Tragic $36,631 |
| Chickasaw | 0.0 /100 | #312 | Tragic $36,475 |
| Bahamians | 0.0 /100 | #313 | Tragic $36,427 |
| Seminole | 0.0 /100 | #314 | Tragic $36,180 |
| Yaqui | 0.0 /100 | #315 | Tragic $36,112 |
| Choctaw | 0.0 /100 | #316 | Tragic $35,999 |
| Dutch West Indians | 0.0 /100 | #317 | Tragic $35,922 |
| Bangladeshis | 0.0 /100 | #318 | Tragic $35,897 |
| Immigrants | Congo | 0.0 /100 | #319 | Tragic $35,720 |
| Hispanics or Latinos | 0.0 /100 | #320 | Tragic $35,688 |
| Blacks/African Americans | 0.0 /100 | #321 | Tragic $35,564 |
Demographics Similar to Immigrants from Barbados by Per Capita Income
In terms of per capita income, the demographic groups most similar to Immigrants from Barbados are Immigrants from Trinidad and Tobago ($41,476, a difference of 0.0%), Puget Sound Salish ($41,495, a difference of 0.040%), Immigrants from Iraq ($41,365, a difference of 0.27%), Immigrants from Cameroon ($41,334, a difference of 0.35%), and Trinidadian and Tobagonian ($41,655, a difference of 0.43%).
| Demographics | Rating | Rank | Per Capita Income |
| Immigrants | Venezuela | 10.2 /100 | #213 | Poor $41,727 |
| Immigrants | Bangladesh | 10.1 /100 | #214 | Poor $41,709 |
| Sudanese | 9.9 /100 | #215 | Tragic $41,695 |
| Tongans | 9.9 /100 | #216 | Tragic $41,693 |
| Guamanians/Chamorros | 9.7 /100 | #217 | Tragic $41,678 |
| Trinidadians and Tobagonians | 9.5 /100 | #218 | Tragic $41,655 |
| Puget Sound Salish | 8.1 /100 | #219 | Tragic $41,495 |
| Immigrants | Barbados | 7.9 /100 | #220 | Tragic $41,478 |
| Immigrants | Trinidad and Tobago | 7.9 /100 | #221 | Tragic $41,476 |
| Immigrants | Iraq | 7.1 /100 | #222 | Tragic $41,365 |
| Immigrants | Cameroon | 6.8 /100 | #223 | Tragic $41,334 |
| Immigrants | St. Vincent and the Grenadines | 6.4 /100 | #224 | Tragic $41,270 |
| West Indians | 6.0 /100 | #225 | Tragic $41,217 |
| Immigrants | Ecuador | 5.9 /100 | #226 | Tragic $41,195 |
| Immigrants | Ghana | 5.5 /100 | #227 | Tragic $41,131 |