American vs Immigrants from Eastern Asia Median Household Income
COMPARE
American
Immigrants from Eastern Asia
Median Household Income
Median Household Income Comparison
Americans
Immigrants from Eastern Asia
$75,932
MEDIAN HOUSEHOLD INCOME
0.3/ 100
METRIC RATING
266th/ 347
METRIC RANK
$104,796
MEDIAN HOUSEHOLD INCOME
100.0/ 100
METRIC RATING
13th/ 347
METRIC RANK
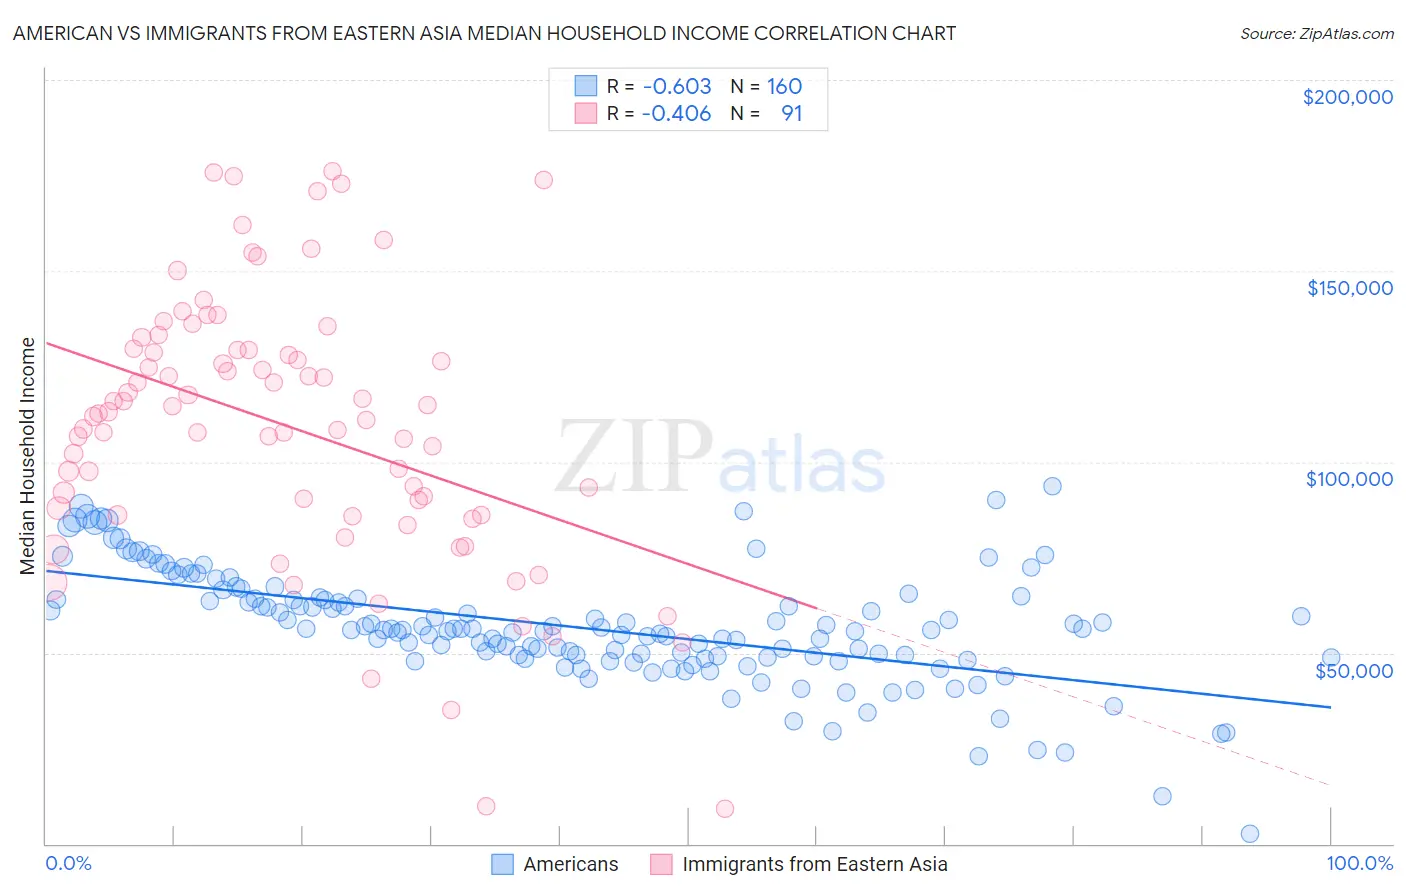
American vs Immigrants from Eastern Asia Median Household Income Correlation Chart
The statistical analysis conducted on geographies consisting of 580,584,472 people shows a significant negative correlation between the proportion of Americans and median household income in the United States with a correlation coefficient (R) of -0.603 and weighted average of $75,932. Similarly, the statistical analysis conducted on geographies consisting of 499,224,968 people shows a moderate negative correlation between the proportion of Immigrants from Eastern Asia and median household income in the United States with a correlation coefficient (R) of -0.406 and weighted average of $104,796, a difference of 38.0%.
Median Household Income Correlation Summary
| Measurement | American | Immigrants from Eastern Asia |
| Minimum | $2,499 | $9,145 |
| Maximum | $93,750 | $175,983 |
| Range | $91,251 | $166,838 |
| Mean | $56,747 | $109,310 |
| Median | $56,097 | $112,551 |
| Interquartile 25% (IQ1) | $48,888 | $86,179 |
| Interquartile 75% (IQ3) | $64,069 | $129,240 |
| Interquartile Range (IQR) | $15,181 | $43,061 |
| Standard Deviation (Sample) | $14,812 | $35,066 |
| Standard Deviation (Population) | $14,765 | $34,873 |
Similar Demographics by Median Household Income
Demographics Similar to Americans by Median Household Income
In terms of median household income, the demographic groups most similar to Americans are Immigrants from Belize ($75,938, a difference of 0.010%), Guatemalan ($75,961, a difference of 0.040%), German Russian ($75,856, a difference of 0.10%), Immigrants from Jamaica ($75,851, a difference of 0.11%), and Cape Verdean ($75,848, a difference of 0.11%).
| Demographics | Rating | Rank | Median Household Income |
| Spanish American Indians | 0.4 /100 | #259 | Tragic $76,670 |
| Jamaicans | 0.4 /100 | #260 | Tragic $76,583 |
| Immigrants | Grenada | 0.4 /100 | #261 | Tragic $76,517 |
| French American Indians | 0.4 /100 | #262 | Tragic $76,387 |
| Alaskan Athabascans | 0.4 /100 | #263 | Tragic $76,383 |
| Guatemalans | 0.3 /100 | #264 | Tragic $75,961 |
| Immigrants | Belize | 0.3 /100 | #265 | Tragic $75,938 |
| Americans | 0.3 /100 | #266 | Tragic $75,932 |
| German Russians | 0.3 /100 | #267 | Tragic $75,856 |
| Immigrants | Jamaica | 0.3 /100 | #268 | Tragic $75,851 |
| Cape Verdeans | 0.3 /100 | #269 | Tragic $75,848 |
| Hmong | 0.3 /100 | #270 | Tragic $75,839 |
| Pennsylvania Germans | 0.3 /100 | #271 | Tragic $75,814 |
| Somalis | 0.3 /100 | #272 | Tragic $75,782 |
| Liberians | 0.2 /100 | #273 | Tragic $75,667 |
Demographics Similar to Immigrants from Eastern Asia by Median Household Income
In terms of median household income, the demographic groups most similar to Immigrants from Eastern Asia are Immigrants from Ireland ($104,692, a difference of 0.10%), Indian (Asian) ($105,262, a difference of 0.45%), Immigrants from China ($105,335, a difference of 0.51%), Immigrants from Israel ($104,090, a difference of 0.68%), and Immigrants from South Central Asia ($106,057, a difference of 1.2%).
| Demographics | Rating | Rank | Median Household Income |
| Immigrants | Singapore | 100.0 /100 | #6 | Exceptional $110,428 |
| Iranians | 100.0 /100 | #7 | Exceptional $109,835 |
| Immigrants | Iran | 100.0 /100 | #8 | Exceptional $108,055 |
| Okinawans | 100.0 /100 | #9 | Exceptional $106,624 |
| Immigrants | South Central Asia | 100.0 /100 | #10 | Exceptional $106,057 |
| Immigrants | China | 100.0 /100 | #11 | Exceptional $105,335 |
| Indians (Asian) | 100.0 /100 | #12 | Exceptional $105,262 |
| Immigrants | Eastern Asia | 100.0 /100 | #13 | Exceptional $104,796 |
| Immigrants | Ireland | 100.0 /100 | #14 | Exceptional $104,692 |
| Immigrants | Israel | 100.0 /100 | #15 | Exceptional $104,090 |
| Burmese | 100.0 /100 | #16 | Exceptional $103,145 |
| Immigrants | Korea | 100.0 /100 | #17 | Exceptional $102,962 |
| Cypriots | 100.0 /100 | #18 | Exceptional $102,843 |
| Immigrants | Australia | 100.0 /100 | #19 | Exceptional $102,562 |
| Bolivians | 100.0 /100 | #20 | Exceptional $102,195 |