American vs Immigrants from Cameroon Householder Income Ages 45 - 64 years
COMPARE
American
Immigrants from Cameroon
Householder Income Ages 45 - 64 years
Householder Income Ages 45 - 64 years Comparison
Americans
Immigrants from Cameroon
$90,536
HOUSEHOLDER INCOME AGES 45 - 64 YEARS
0.7/ 100
METRIC RATING
251st/ 347
METRIC RANK
$100,084
HOUSEHOLDER INCOME AGES 45 - 64 YEARS
47.0/ 100
METRIC RATING
178th/ 347
METRIC RANK
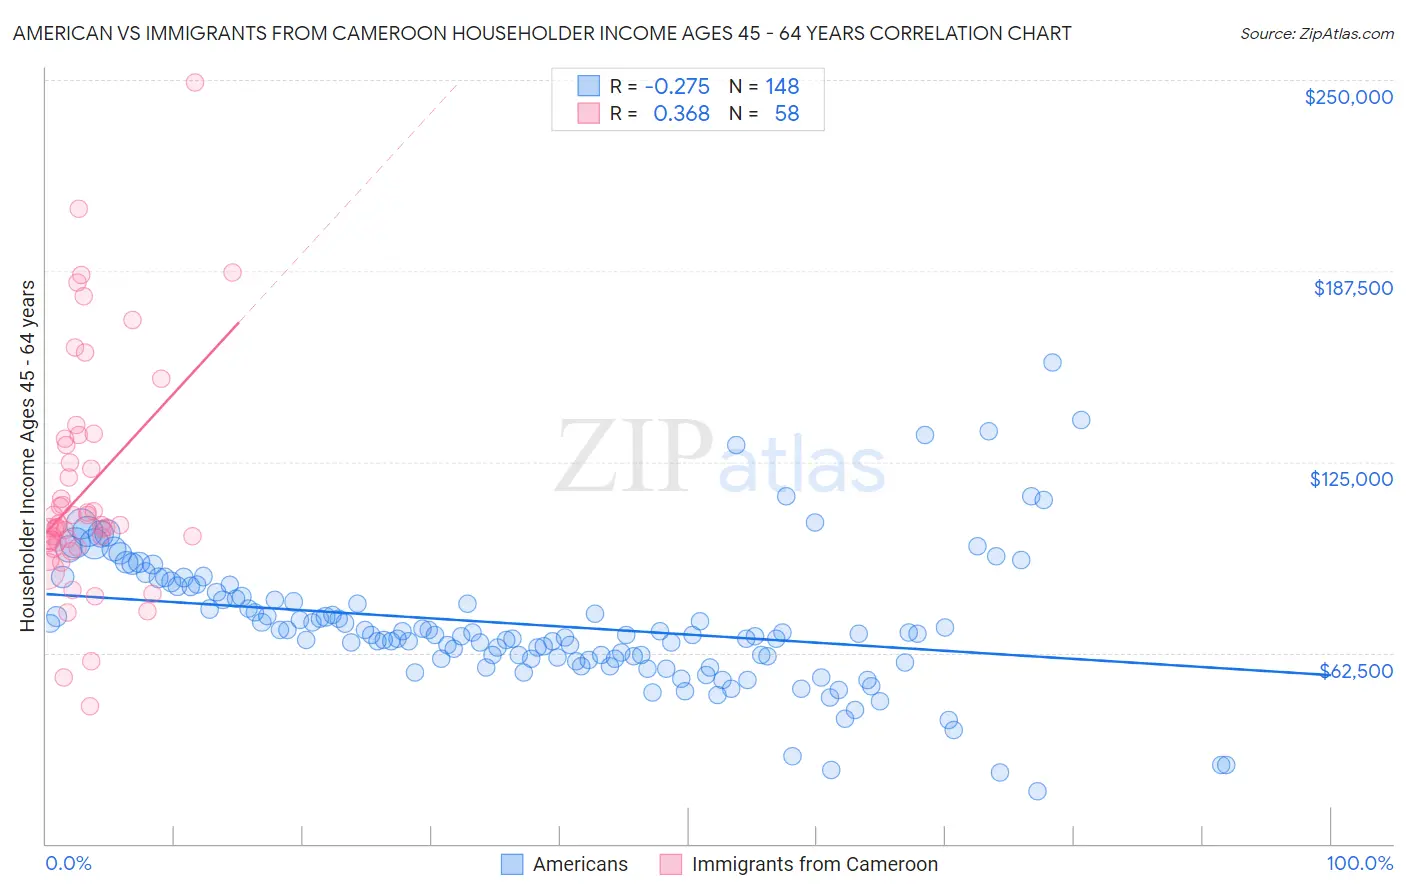
American vs Immigrants from Cameroon Householder Income Ages 45 - 64 years Correlation Chart
The statistical analysis conducted on geographies consisting of 577,131,423 people shows a weak negative correlation between the proportion of Americans and household income with householder between the ages 45 and 64 in the United States with a correlation coefficient (R) of -0.275 and weighted average of $90,536. Similarly, the statistical analysis conducted on geographies consisting of 130,699,508 people shows a mild positive correlation between the proportion of Immigrants from Cameroon and household income with householder between the ages 45 and 64 in the United States with a correlation coefficient (R) of 0.368 and weighted average of $100,084, a difference of 10.5%.
Householder Income Ages 45 - 64 years Correlation Summary
| Measurement | American | Immigrants from Cameroon |
| Minimum | $17,292 | $45,128 |
| Maximum | $157,566 | $249,250 |
| Range | $140,274 | $204,122 |
| Mean | $71,716 | $115,608 |
| Median | $68,424 | $104,009 |
| Interquartile 25% (IQ1) | $60,397 | $98,639 |
| Interquartile 75% (IQ3) | $81,558 | $130,520 |
| Interquartile Range (IQR) | $21,160 | $31,881 |
| Standard Deviation (Sample) | $21,955 | $37,628 |
| Standard Deviation (Population) | $21,881 | $37,302 |
Similar Demographics by Householder Income Ages 45 - 64 years
Demographics Similar to Americans by Householder Income Ages 45 - 64 years
In terms of householder income ages 45 - 64 years, the demographic groups most similar to Americans are Marshallese ($90,455, a difference of 0.090%), Subsaharan African ($90,691, a difference of 0.17%), Mexican American Indian ($90,811, a difference of 0.30%), Barbadian ($90,266, a difference of 0.30%), and Immigrants from Guyana ($90,186, a difference of 0.39%).
| Demographics | Rating | Rank | Householder Income Ages 45 - 64 years |
| Immigrants | Middle Africa | 1.1 /100 | #244 | Tragic $91,293 |
| Guyanese | 0.9 /100 | #245 | Tragic $90,966 |
| Central Americans | 0.9 /100 | #246 | Tragic $90,951 |
| Alaskan Athabascans | 0.9 /100 | #247 | Tragic $90,951 |
| Immigrants | Laos | 0.9 /100 | #248 | Tragic $90,909 |
| Mexican American Indians | 0.8 /100 | #249 | Tragic $90,811 |
| Sub-Saharan Africans | 0.8 /100 | #250 | Tragic $90,691 |
| Americans | 0.7 /100 | #251 | Tragic $90,536 |
| Marshallese | 0.7 /100 | #252 | Tragic $90,455 |
| Barbadians | 0.6 /100 | #253 | Tragic $90,266 |
| Immigrants | Guyana | 0.6 /100 | #254 | Tragic $90,186 |
| West Indians | 0.5 /100 | #255 | Tragic $89,906 |
| French American Indians | 0.5 /100 | #256 | Tragic $89,811 |
| German Russians | 0.4 /100 | #257 | Tragic $89,398 |
| Immigrants | Barbados | 0.4 /100 | #258 | Tragic $89,394 |
Demographics Similar to Immigrants from Cameroon by Householder Income Ages 45 - 64 years
In terms of householder income ages 45 - 64 years, the demographic groups most similar to Immigrants from Cameroon are Belgian ($100,060, a difference of 0.020%), Aleut ($100,052, a difference of 0.030%), Moroccan ($100,138, a difference of 0.050%), Immigrants from Costa Rica ($100,141, a difference of 0.060%), and German ($100,224, a difference of 0.14%).
| Demographics | Rating | Rank | Householder Income Ages 45 - 64 years |
| South Americans | 56.4 /100 | #171 | Average $100,837 |
| Immigrants | Uzbekistan | 52.5 /100 | #172 | Average $100,523 |
| Alsatians | 51.4 /100 | #173 | Average $100,435 |
| Welsh | 50.0 /100 | #174 | Average $100,322 |
| Germans | 48.8 /100 | #175 | Average $100,224 |
| Immigrants | Costa Rica | 47.7 /100 | #176 | Average $100,141 |
| Moroccans | 47.7 /100 | #177 | Average $100,138 |
| Immigrants | Cameroon | 47.0 /100 | #178 | Average $100,084 |
| Belgians | 46.7 /100 | #179 | Average $100,060 |
| Aleuts | 46.6 /100 | #180 | Average $100,052 |
| Immigrants | Immigrants | 45.3 /100 | #181 | Average $99,943 |
| Finns | 44.8 /100 | #182 | Average $99,904 |
| Spaniards | 44.6 /100 | #183 | Average $99,889 |
| French | 43.8 /100 | #184 | Average $99,824 |
| Colombians | 43.2 /100 | #185 | Average $99,772 |