American vs Immigrants from Ireland Householder Income Ages 45 - 64 years
COMPARE
American
Immigrants from Ireland
Householder Income Ages 45 - 64 years
Householder Income Ages 45 - 64 years Comparison
Americans
Immigrants from Ireland
$90,536
HOUSEHOLDER INCOME AGES 45 - 64 YEARS
0.7/ 100
METRIC RATING
251st/ 347
METRIC RANK
$122,757
HOUSEHOLDER INCOME AGES 45 - 64 YEARS
100.0/ 100
METRIC RATING
13th/ 347
METRIC RANK
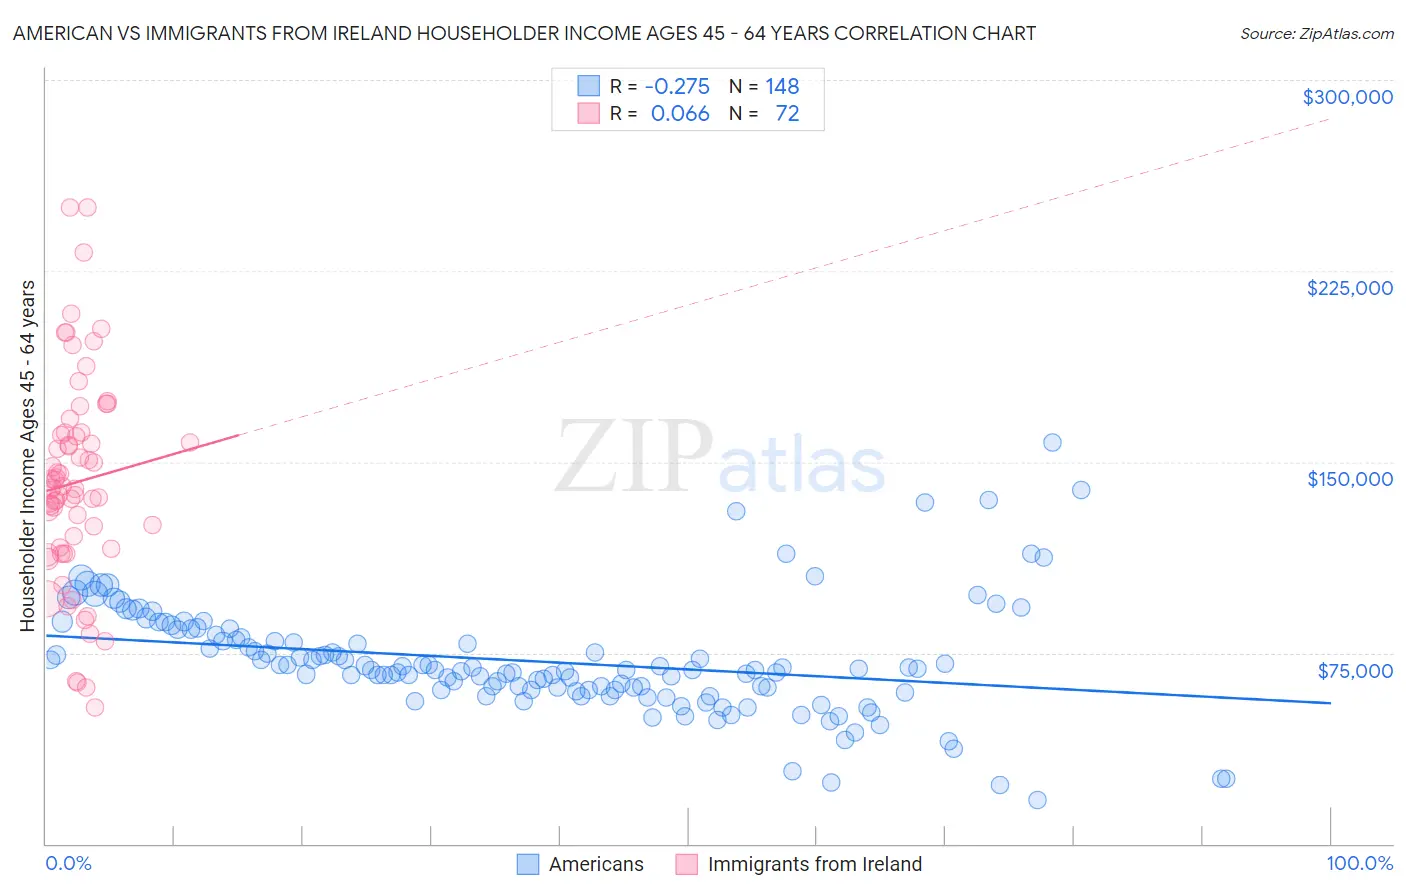
American vs Immigrants from Ireland Householder Income Ages 45 - 64 years Correlation Chart
The statistical analysis conducted on geographies consisting of 577,131,423 people shows a weak negative correlation between the proportion of Americans and household income with householder between the ages 45 and 64 in the United States with a correlation coefficient (R) of -0.275 and weighted average of $90,536. Similarly, the statistical analysis conducted on geographies consisting of 240,617,521 people shows a slight positive correlation between the proportion of Immigrants from Ireland and household income with householder between the ages 45 and 64 in the United States with a correlation coefficient (R) of 0.066 and weighted average of $122,757, a difference of 35.6%.
Householder Income Ages 45 - 64 years Correlation Summary
| Measurement | American | Immigrants from Ireland |
| Minimum | $17,292 | $53,750 |
| Maximum | $157,566 | $250,001 |
| Range | $140,274 | $196,251 |
| Mean | $71,716 | $141,948 |
| Median | $68,424 | $139,768 |
| Interquartile 25% (IQ1) | $60,397 | $116,086 |
| Interquartile 75% (IQ3) | $81,558 | $161,016 |
| Interquartile Range (IQR) | $21,160 | $44,930 |
| Standard Deviation (Sample) | $21,955 | $40,881 |
| Standard Deviation (Population) | $21,881 | $40,596 |
Similar Demographics by Householder Income Ages 45 - 64 years
Demographics Similar to Americans by Householder Income Ages 45 - 64 years
In terms of householder income ages 45 - 64 years, the demographic groups most similar to Americans are Marshallese ($90,455, a difference of 0.090%), Subsaharan African ($90,691, a difference of 0.17%), Mexican American Indian ($90,811, a difference of 0.30%), Barbadian ($90,266, a difference of 0.30%), and Immigrants from Guyana ($90,186, a difference of 0.39%).
| Demographics | Rating | Rank | Householder Income Ages 45 - 64 years |
| Immigrants | Middle Africa | 1.1 /100 | #244 | Tragic $91,293 |
| Guyanese | 0.9 /100 | #245 | Tragic $90,966 |
| Central Americans | 0.9 /100 | #246 | Tragic $90,951 |
| Alaskan Athabascans | 0.9 /100 | #247 | Tragic $90,951 |
| Immigrants | Laos | 0.9 /100 | #248 | Tragic $90,909 |
| Mexican American Indians | 0.8 /100 | #249 | Tragic $90,811 |
| Sub-Saharan Africans | 0.8 /100 | #250 | Tragic $90,691 |
| Americans | 0.7 /100 | #251 | Tragic $90,536 |
| Marshallese | 0.7 /100 | #252 | Tragic $90,455 |
| Barbadians | 0.6 /100 | #253 | Tragic $90,266 |
| Immigrants | Guyana | 0.6 /100 | #254 | Tragic $90,186 |
| West Indians | 0.5 /100 | #255 | Tragic $89,906 |
| French American Indians | 0.5 /100 | #256 | Tragic $89,811 |
| German Russians | 0.4 /100 | #257 | Tragic $89,398 |
| Immigrants | Barbados | 0.4 /100 | #258 | Tragic $89,394 |
Demographics Similar to Immigrants from Ireland by Householder Income Ages 45 - 64 years
In terms of householder income ages 45 - 64 years, the demographic groups most similar to Immigrants from Ireland are Immigrants from Israel ($122,893, a difference of 0.11%), Indian (Asian) ($122,343, a difference of 0.34%), Immigrants from Eastern Asia ($122,222, a difference of 0.44%), Immigrants from China ($122,178, a difference of 0.47%), and Cypriot ($123,396, a difference of 0.52%).
| Demographics | Rating | Rank | Householder Income Ages 45 - 64 years |
| Iranians | 100.0 /100 | #6 | Exceptional $129,350 |
| Immigrants | Hong Kong | 100.0 /100 | #7 | Exceptional $127,500 |
| Immigrants | Iran | 100.0 /100 | #8 | Exceptional $126,940 |
| Okinawans | 100.0 /100 | #9 | Exceptional $124,796 |
| Immigrants | South Central Asia | 100.0 /100 | #10 | Exceptional $124,188 |
| Cypriots | 100.0 /100 | #11 | Exceptional $123,396 |
| Immigrants | Israel | 100.0 /100 | #12 | Exceptional $122,893 |
| Immigrants | Ireland | 100.0 /100 | #13 | Exceptional $122,757 |
| Indians (Asian) | 100.0 /100 | #14 | Exceptional $122,343 |
| Immigrants | Eastern Asia | 100.0 /100 | #15 | Exceptional $122,222 |
| Immigrants | China | 100.0 /100 | #16 | Exceptional $122,178 |
| Burmese | 100.0 /100 | #17 | Exceptional $121,444 |
| Immigrants | Korea | 100.0 /100 | #18 | Exceptional $121,243 |
| Eastern Europeans | 100.0 /100 | #19 | Exceptional $120,684 |
| Immigrants | Australia | 100.0 /100 | #20 | Exceptional $119,308 |