American vs Immigrants from Cameroon Unemployment Among Ages 25 to 29 years
COMPARE
American
Immigrants from Cameroon
Unemployment Among Ages 25 to 29 years
Unemployment Among Ages 25 to 29 years Comparison
Americans
Immigrants from Cameroon
7.4%
UNEMPLOYMENT AMONG AGES 25 TO 29 YEARS
0.1/ 100
METRIC RATING
260th/ 347
METRIC RANK
7.2%
UNEMPLOYMENT AMONG AGES 25 TO 29 YEARS
0.3/ 100
METRIC RATING
255th/ 347
METRIC RANK
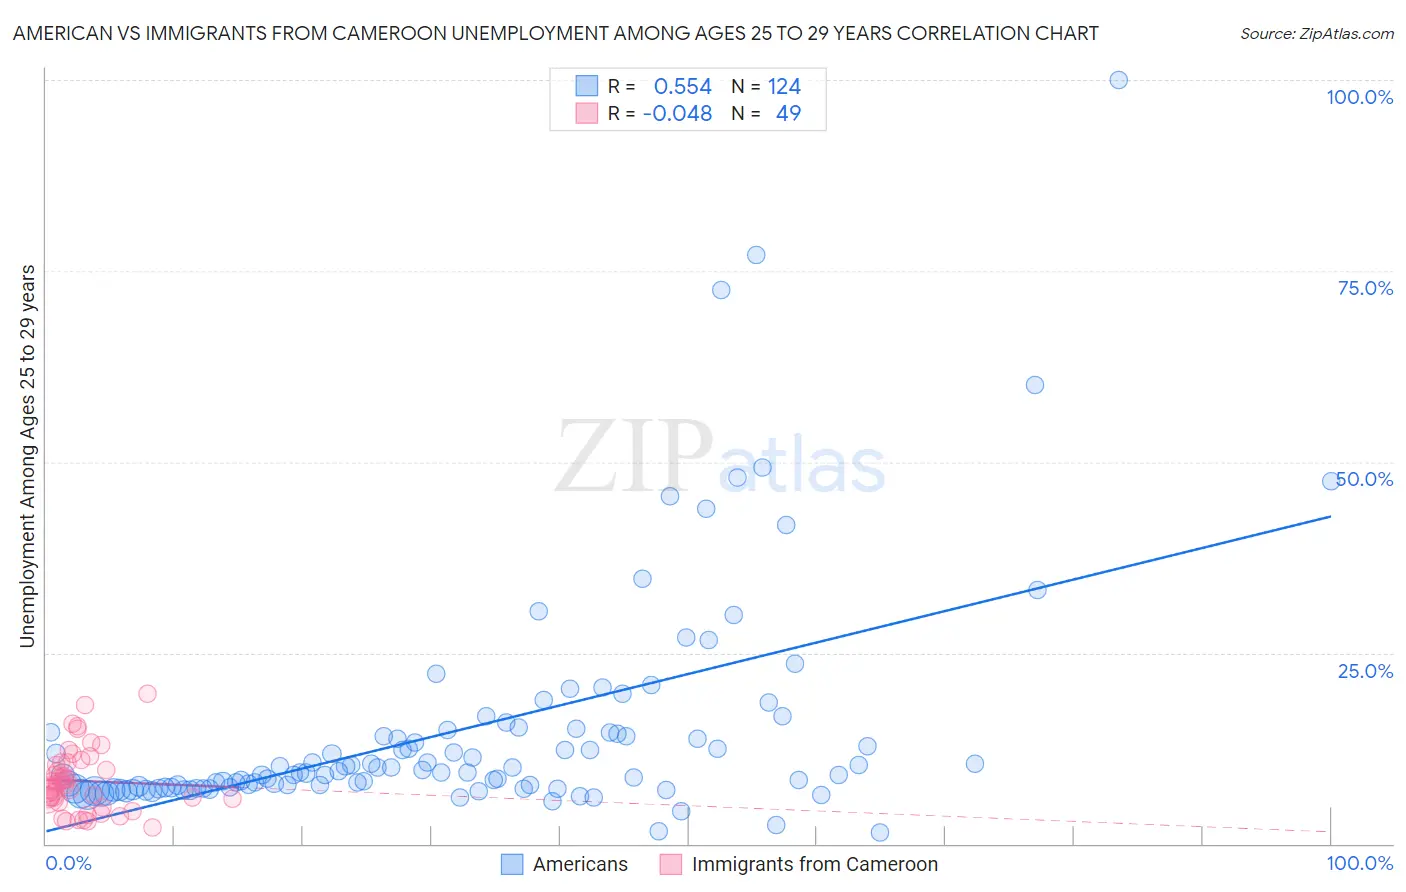
American vs Immigrants from Cameroon Unemployment Among Ages 25 to 29 years Correlation Chart
The statistical analysis conducted on geographies consisting of 512,790,797 people shows a substantial positive correlation between the proportion of Americans and unemployment rate among population between the ages 25 and 29 in the United States with a correlation coefficient (R) of 0.554 and weighted average of 7.4%. Similarly, the statistical analysis conducted on geographies consisting of 129,226,565 people shows no correlation between the proportion of Immigrants from Cameroon and unemployment rate among population between the ages 25 and 29 in the United States with a correlation coefficient (R) of -0.048 and weighted average of 7.2%, a difference of 1.7%.
Unemployment Among Ages 25 to 29 years Correlation Summary
| Measurement | American | Immigrants from Cameroon |
| Minimum | 1.5% | 2.2% |
| Maximum | 100.0% | 19.6% |
| Range | 98.5% | 17.4% |
| Mean | 14.9% | 8.2% |
| Median | 9.4% | 7.7% |
| Interquartile 25% (IQ1) | 7.3% | 5.6% |
| Interquartile 75% (IQ3) | 14.6% | 10.7% |
| Interquartile Range (IQR) | 7.3% | 5.1% |
| Standard Deviation (Sample) | 15.1% | 4.1% |
| Standard Deviation (Population) | 15.1% | 4.1% |
Demographics Similar to Americans and Immigrants from Cameroon by Unemployment Among Ages 25 to 29 years
In terms of unemployment among ages 25 to 29 years, the demographic groups most similar to Americans are Nigerian (7.4%, a difference of 0.080%), Ecuadorian (7.4%, a difference of 0.14%), Kiowa (7.4%, a difference of 0.22%), Immigrants from Western Africa (7.4%, a difference of 0.31%), and Immigrants from Fiji (7.4%, a difference of 0.37%). Similarly, the demographic groups most similar to Immigrants from Cameroon are Ghanaian (7.2%, a difference of 0.060%), Mexican American Indian (7.3%, a difference of 0.20%), Immigrants from Portugal (7.2%, a difference of 0.21%), Sierra Leonean (7.2%, a difference of 0.53%), and Assyrian/Chaldean/Syriac (7.3%, a difference of 0.57%).
| Demographics | Rating | Rank | Unemployment Among Ages 25 to 29 years |
| Immigrants | Guatemala | 0.7 /100 | #247 | Tragic 7.2% |
| Sub-Saharan Africans | 0.6 /100 | #248 | Tragic 7.2% |
| Seminole | 0.6 /100 | #249 | Tragic 7.2% |
| Delaware | 0.5 /100 | #250 | Tragic 7.2% |
| Portuguese | 0.5 /100 | #251 | Tragic 7.2% |
| Sierra Leoneans | 0.4 /100 | #252 | Tragic 7.2% |
| Immigrants | Portugal | 0.3 /100 | #253 | Tragic 7.2% |
| Ghanaians | 0.3 /100 | #254 | Tragic 7.2% |
| Immigrants | Cameroon | 0.3 /100 | #255 | Tragic 7.2% |
| Mexican American Indians | 0.3 /100 | #256 | Tragic 7.3% |
| Assyrians/Chaldeans/Syriacs | 0.2 /100 | #257 | Tragic 7.3% |
| Ottawa | 0.1 /100 | #258 | Tragic 7.3% |
| Cree | 0.1 /100 | #259 | Tragic 7.3% |
| Americans | 0.1 /100 | #260 | Tragic 7.4% |
| Nigerians | 0.1 /100 | #261 | Tragic 7.4% |
| Ecuadorians | 0.1 /100 | #262 | Tragic 7.4% |
| Kiowa | 0.1 /100 | #263 | Tragic 7.4% |
| Immigrants | Western Africa | 0.1 /100 | #264 | Tragic 7.4% |
| Immigrants | Fiji | 0.1 /100 | #265 | Tragic 7.4% |
| Paiute | 0.1 /100 | #266 | Tragic 7.4% |
| Pennsylvania Germans | 0.1 /100 | #267 | Tragic 7.4% |