Alsatian vs Immigrants from Mexico Householder Income Under 25 years
COMPARE
Alsatian
Immigrants from Mexico
Householder Income Under 25 years
Householder Income Under 25 years Comparison
Alsatians
Immigrants from Mexico
$49,267
HOUSEHOLDER INCOME UNDER 25 YEARS
0.1/ 100
METRIC RATING
282nd/ 347
METRIC RANK
$50,422
HOUSEHOLDER INCOME UNDER 25 YEARS
1.3/ 100
METRIC RATING
252nd/ 347
METRIC RANK
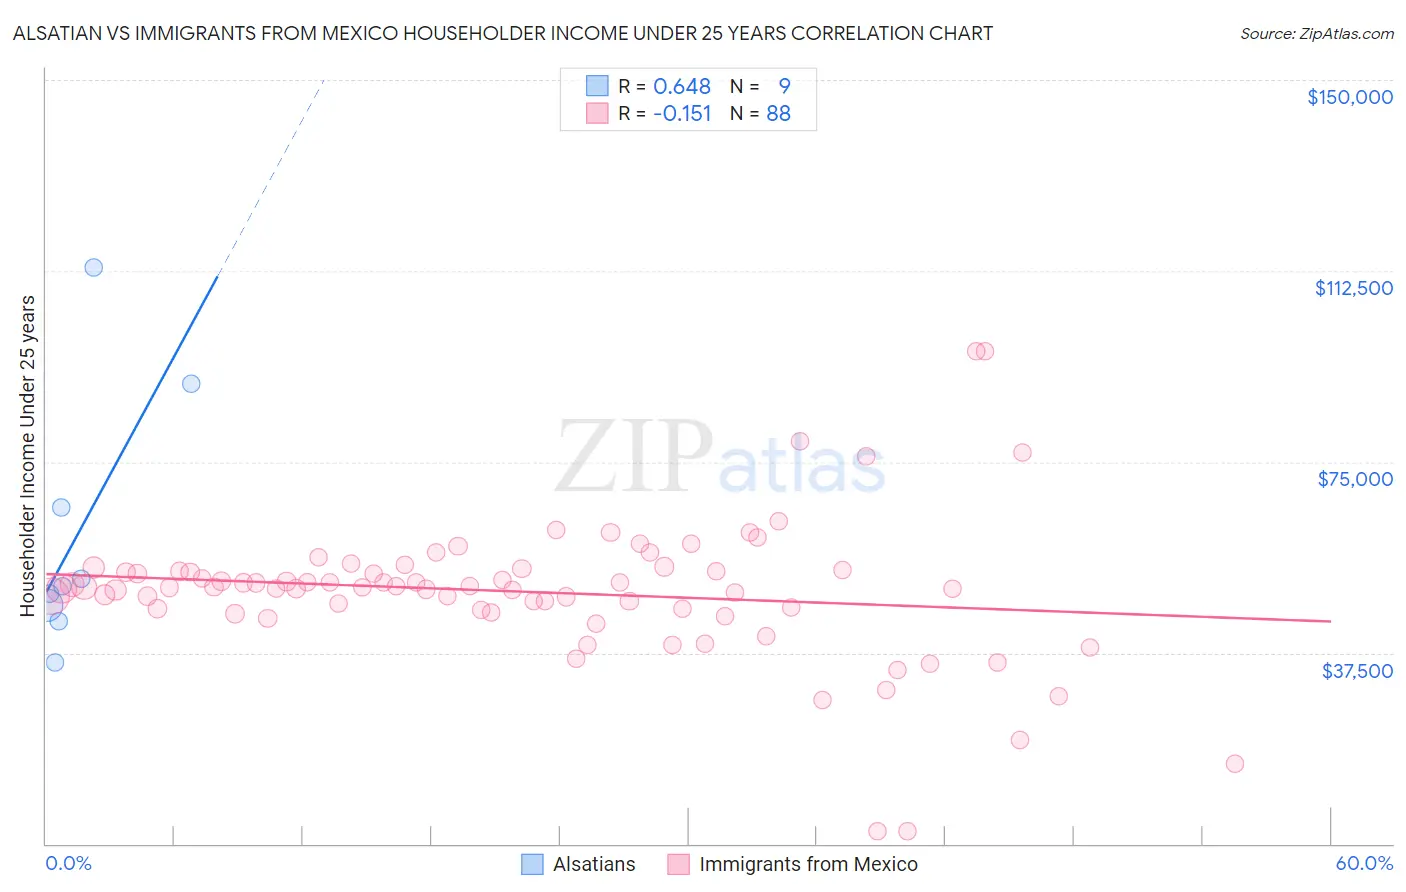
Alsatian vs Immigrants from Mexico Householder Income Under 25 years Correlation Chart
The statistical analysis conducted on geographies consisting of 77,564,981 people shows a significant positive correlation between the proportion of Alsatians and household income with householder under the age of 25 in the United States with a correlation coefficient (R) of 0.648 and weighted average of $49,267. Similarly, the statistical analysis conducted on geographies consisting of 414,348,765 people shows a poor negative correlation between the proportion of Immigrants from Mexico and household income with householder under the age of 25 in the United States with a correlation coefficient (R) of -0.151 and weighted average of $50,422, a difference of 2.3%.
Householder Income Under 25 years Correlation Summary
| Measurement | Alsatian | Immigrants from Mexico |
| Minimum | $35,598 | $2,499 |
| Maximum | $113,281 | $96,667 |
| Range | $77,683 | $94,168 |
| Mean | $60,844 | $49,454 |
| Median | $50,662 | $50,399 |
| Interquartile 25% (IQ1) | $45,251 | $45,992 |
| Interquartile 75% (IQ3) | $78,194 | $53,646 |
| Interquartile Range (IQR) | $32,943 | $7,654 |
| Standard Deviation (Sample) | $25,229 | $14,134 |
| Standard Deviation (Population) | $23,786 | $14,054 |
Similar Demographics by Householder Income Under 25 years
Demographics Similar to Alsatians by Householder Income Under 25 years
In terms of householder income under 25 years, the demographic groups most similar to Alsatians are Nonimmigrants ($49,348, a difference of 0.16%), Immigrants from Nigeria ($49,174, a difference of 0.19%), Hmong ($49,364, a difference of 0.20%), Apache ($49,395, a difference of 0.26%), and Nigerian ($49,416, a difference of 0.30%).
| Demographics | Rating | Rank | Householder Income Under 25 years |
| Immigrants | Kenya | 0.2 /100 | #275 | Tragic $49,633 |
| Dominicans | 0.2 /100 | #276 | Tragic $49,633 |
| Immigrants | Western Africa | 0.2 /100 | #277 | Tragic $49,621 |
| Nigerians | 0.1 /100 | #278 | Tragic $49,416 |
| Apache | 0.1 /100 | #279 | Tragic $49,395 |
| Hmong | 0.1 /100 | #280 | Tragic $49,364 |
| Immigrants | Nonimmigrants | 0.1 /100 | #281 | Tragic $49,348 |
| Alsatians | 0.1 /100 | #282 | Tragic $49,267 |
| Immigrants | Nigeria | 0.1 /100 | #283 | Tragic $49,174 |
| Carpatho Rusyns | 0.1 /100 | #284 | Tragic $49,113 |
| Scotch-Irish | 0.0 /100 | #285 | Tragic $49,039 |
| French American Indians | 0.0 /100 | #286 | Tragic $48,977 |
| Senegalese | 0.0 /100 | #287 | Tragic $48,953 |
| Liberians | 0.0 /100 | #288 | Tragic $48,917 |
| Hondurans | 0.0 /100 | #289 | Tragic $48,885 |
Demographics Similar to Immigrants from Mexico by Householder Income Under 25 years
In terms of householder income under 25 years, the demographic groups most similar to Immigrants from Mexico are Celtic ($50,447, a difference of 0.050%), Immigrants from Haiti ($50,398, a difference of 0.050%), Luxembourger ($50,379, a difference of 0.080%), Aleut ($50,377, a difference of 0.090%), and Immigrants from Cuba ($50,374, a difference of 0.090%).
| Demographics | Rating | Rank | Householder Income Under 25 years |
| Immigrants | Africa | 2.0 /100 | #245 | Tragic $50,609 |
| Welsh | 2.0 /100 | #246 | Tragic $50,597 |
| Immigrants | Bosnia and Herzegovina | 1.8 /100 | #247 | Tragic $50,565 |
| Slavs | 1.8 /100 | #248 | Tragic $50,563 |
| Scottish | 1.8 /100 | #249 | Tragic $50,554 |
| Immigrants | Cabo Verde | 1.7 /100 | #250 | Tragic $50,520 |
| Celtics | 1.4 /100 | #251 | Tragic $50,447 |
| Immigrants | Mexico | 1.3 /100 | #252 | Tragic $50,422 |
| Immigrants | Haiti | 1.2 /100 | #253 | Tragic $50,398 |
| Luxembourgers | 1.2 /100 | #254 | Tragic $50,379 |
| Aleuts | 1.2 /100 | #255 | Tragic $50,377 |
| Immigrants | Cuba | 1.2 /100 | #256 | Tragic $50,374 |
| Lebanese | 1.1 /100 | #257 | Tragic $50,355 |
| Whites/Caucasians | 1.1 /100 | #258 | Tragic $50,336 |
| Immigrants | Dominica | 1.0 /100 | #259 | Tragic $50,301 |