Alsatian vs Immigrants from Iraq Doctorate Degree
COMPARE
Alsatian
Immigrants from Iraq
Doctorate Degree
Doctorate Degree Comparison
Alsatians
Immigrants from Iraq
2.1%
DOCTORATE DEGREE
99.0/ 100
METRIC RATING
93rd/ 347
METRIC RANK
1.7%
DOCTORATE DEGREE
10.7/ 100
METRIC RATING
219th/ 347
METRIC RANK
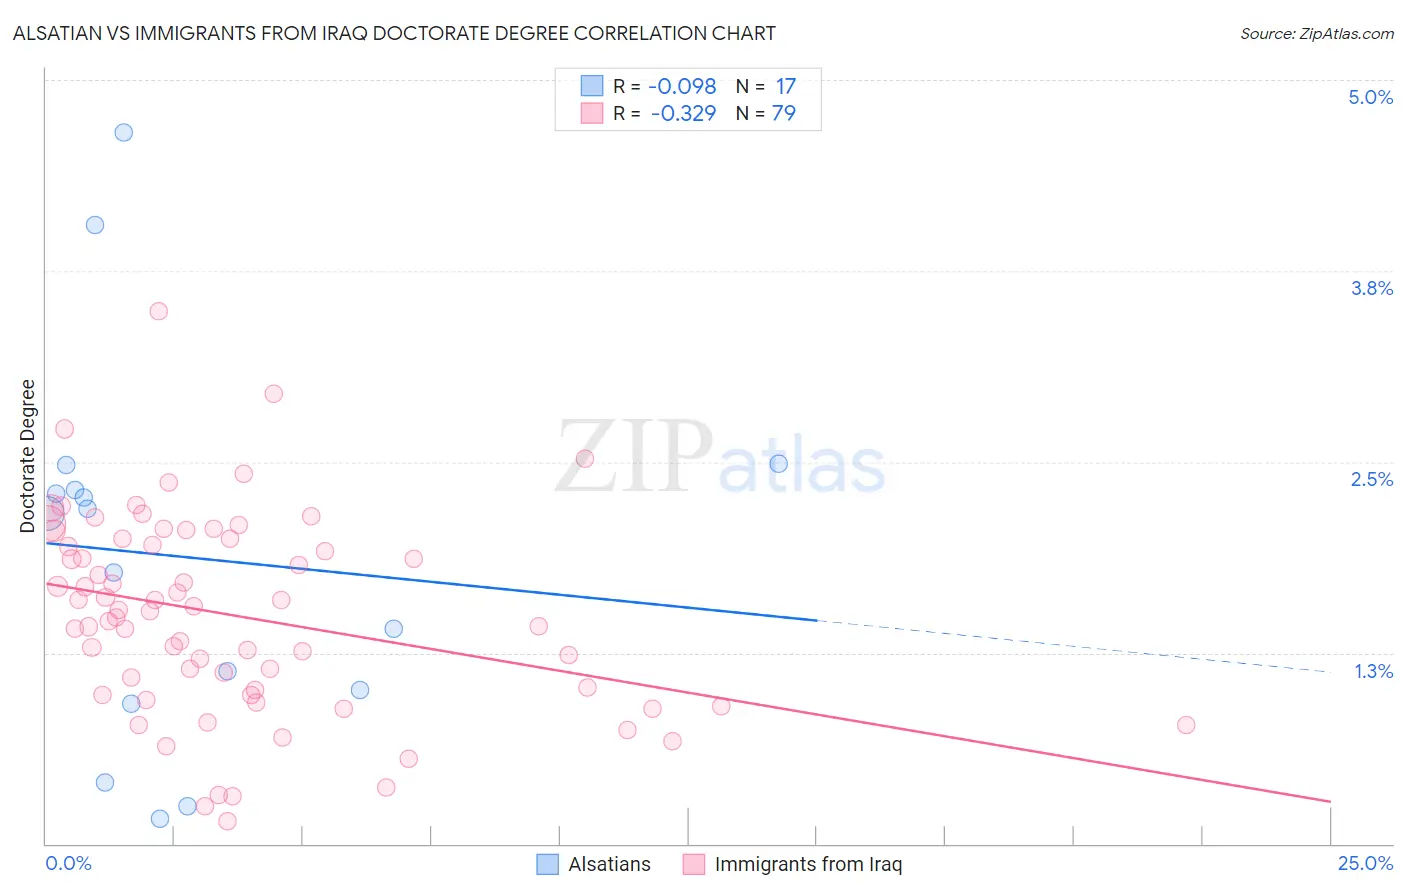
Alsatian vs Immigrants from Iraq Doctorate Degree Correlation Chart
The statistical analysis conducted on geographies consisting of 82,508,744 people shows a slight negative correlation between the proportion of Alsatians and percentage of population with at least doctorate degree education in the United States with a correlation coefficient (R) of -0.098 and weighted average of 2.1%. Similarly, the statistical analysis conducted on geographies consisting of 194,187,251 people shows a mild negative correlation between the proportion of Immigrants from Iraq and percentage of population with at least doctorate degree education in the United States with a correlation coefficient (R) of -0.329 and weighted average of 1.7%, a difference of 26.6%.
Doctorate Degree Correlation Summary
| Measurement | Alsatian | Immigrants from Iraq |
| Minimum | 0.17% | 0.15% |
| Maximum | 4.7% | 3.5% |
| Range | 4.5% | 3.3% |
| Mean | 1.9% | 1.5% |
| Median | 2.2% | 1.5% |
| Interquartile 25% (IQ1) | 0.96% | 0.97% |
| Interquartile 75% (IQ3) | 2.4% | 2.0% |
| Interquartile Range (IQR) | 1.4% | 1.0% |
| Standard Deviation (Sample) | 1.2% | 0.65% |
| Standard Deviation (Population) | 1.2% | 0.65% |
Similar Demographics by Doctorate Degree
Demographics Similar to Alsatians by Doctorate Degree
In terms of doctorate degree, the demographic groups most similar to Alsatians are Chilean (2.2%, a difference of 0.22%), Immigrants from Sudan (2.2%, a difference of 0.48%), Greek (2.1%, a difference of 0.64%), Immigrants from Romania (2.1%, a difference of 0.78%), and Immigrants from Scotland (2.2%, a difference of 0.95%).
| Demographics | Rating | Rank | Doctorate Degree |
| Egyptians | 99.4 /100 | #86 | Exceptional 2.2% |
| Immigrants | Zimbabwe | 99.4 /100 | #87 | Exceptional 2.2% |
| Immigrants | Nepal | 99.3 /100 | #88 | Exceptional 2.2% |
| British | 99.3 /100 | #89 | Exceptional 2.2% |
| Immigrants | Scotland | 99.2 /100 | #90 | Exceptional 2.2% |
| Immigrants | Sudan | 99.1 /100 | #91 | Exceptional 2.2% |
| Chileans | 99.1 /100 | #92 | Exceptional 2.2% |
| Alsatians | 99.0 /100 | #93 | Exceptional 2.1% |
| Greeks | 98.8 /100 | #94 | Exceptional 2.1% |
| Immigrants | Romania | 98.7 /100 | #95 | Exceptional 2.1% |
| Immigrants | Northern Africa | 98.4 /100 | #96 | Exceptional 2.1% |
| Immigrants | Eritrea | 98.4 /100 | #97 | Exceptional 2.1% |
| Armenians | 98.3 /100 | #98 | Exceptional 2.1% |
| Immigrants | Egypt | 98.2 /100 | #99 | Exceptional 2.1% |
| Immigrants | Eastern Europe | 98.2 /100 | #100 | Exceptional 2.1% |
Demographics Similar to Immigrants from Iraq by Doctorate Degree
In terms of doctorate degree, the demographic groups most similar to Immigrants from Iraq are Tlingit-Haida (1.7%, a difference of 0.46%), Immigrants from Uruguay (1.7%, a difference of 0.66%), Spanish American (1.7%, a difference of 0.84%), Nonimmigrants (1.7%, a difference of 0.85%), and Immigrants from Venezuela (1.7%, a difference of 0.92%).
| Demographics | Rating | Rank | Doctorate Degree |
| Immigrants | South Eastern Asia | 14.7 /100 | #212 | Poor 1.7% |
| Koreans | 14.2 /100 | #213 | Poor 1.7% |
| Pueblo | 14.2 /100 | #214 | Poor 1.7% |
| Alaskan Athabascans | 13.8 /100 | #215 | Poor 1.7% |
| Immigrants | Burma/Myanmar | 13.5 /100 | #216 | Poor 1.7% |
| Spanish Americans | 12.9 /100 | #217 | Poor 1.7% |
| Tlingit-Haida | 11.9 /100 | #218 | Poor 1.7% |
| Immigrants | Iraq | 10.7 /100 | #219 | Poor 1.7% |
| Immigrants | Uruguay | 9.2 /100 | #220 | Tragic 1.7% |
| Immigrants | Nonimmigrants | 8.8 /100 | #221 | Tragic 1.7% |
| Immigrants | Venezuela | 8.7 /100 | #222 | Tragic 1.7% |
| Immigrants | Bosnia and Herzegovina | 7.8 /100 | #223 | Tragic 1.7% |
| Immigrants | Poland | 7.4 /100 | #224 | Tragic 1.7% |
| Immigrants | Colombia | 6.7 /100 | #225 | Tragic 1.7% |
| Osage | 6.5 /100 | #226 | Tragic 1.7% |