Alsatian vs Immigrants from Iraq 7th Grade
COMPARE
Alsatian
Immigrants from Iraq
7th Grade
7th Grade Comparison
Alsatians
Immigrants from Iraq
96.1%
7TH GRADE
67.2/ 100
METRIC RATING
159th/ 347
METRIC RANK
96.0%
7TH GRADE
36.1/ 100
METRIC RATING
186th/ 347
METRIC RANK
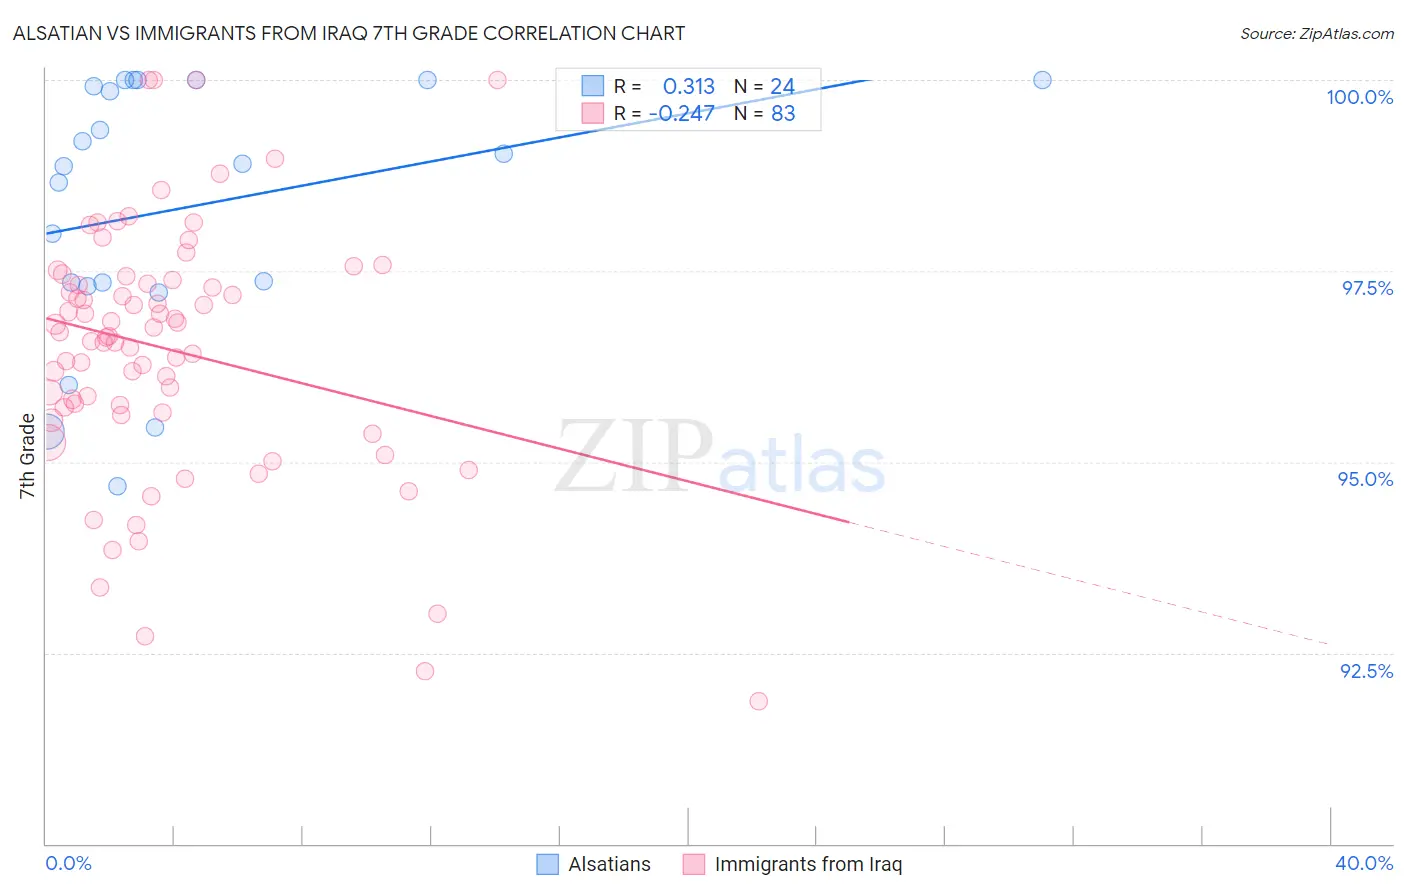
Alsatian vs Immigrants from Iraq 7th Grade Correlation Chart
The statistical analysis conducted on geographies consisting of 82,676,581 people shows a mild positive correlation between the proportion of Alsatians and percentage of population with at least 7th grade education in the United States with a correlation coefficient (R) of 0.313 and weighted average of 96.1%. Similarly, the statistical analysis conducted on geographies consisting of 194,632,332 people shows a weak negative correlation between the proportion of Immigrants from Iraq and percentage of population with at least 7th grade education in the United States with a correlation coefficient (R) of -0.247 and weighted average of 96.0%, a difference of 0.20%.
7th Grade Correlation Summary
| Measurement | Alsatian | Immigrants from Iraq |
| Minimum | 94.7% | 91.9% |
| Maximum | 100.0% | 100.0% |
| Range | 5.3% | 8.1% |
| Mean | 98.3% | 96.5% |
| Median | 98.9% | 96.6% |
| Interquartile 25% (IQ1) | 97.3% | 95.7% |
| Interquartile 75% (IQ3) | 100.0% | 97.4% |
| Interquartile Range (IQR) | 2.6% | 1.7% |
| Standard Deviation (Sample) | 1.7% | 1.7% |
| Standard Deviation (Population) | 1.7% | 1.6% |
Similar Demographics by 7th Grade
Demographics Similar to Alsatians by 7th Grade
In terms of 7th grade, the demographic groups most similar to Alsatians are Immigrants from Kenya (96.1%, a difference of 0.0%), Arab (96.2%, a difference of 0.010%), Bermudan (96.1%, a difference of 0.010%), Pima (96.1%, a difference of 0.020%), and Spaniard (96.1%, a difference of 0.030%).
| Demographics | Rating | Rank | 7th Grade |
| Immigrants | Russia | 78.4 /100 | #152 | Good 96.2% |
| Seminole | 78.1 /100 | #153 | Good 96.2% |
| Immigrants | Israel | 77.6 /100 | #154 | Good 96.2% |
| Immigrants | Jordan | 77.0 /100 | #155 | Good 96.2% |
| Kenyans | 76.2 /100 | #156 | Good 96.2% |
| Ugandans | 75.5 /100 | #157 | Good 96.2% |
| Arabs | 68.6 /100 | #158 | Good 96.2% |
| Alsatians | 67.2 /100 | #159 | Good 96.1% |
| Immigrants | Kenya | 66.8 /100 | #160 | Good 96.1% |
| Bermudans | 66.3 /100 | #161 | Good 96.1% |
| Pima | 64.3 /100 | #162 | Good 96.1% |
| Spaniards | 62.6 /100 | #163 | Good 96.1% |
| Immigrants | Italy | 62.1 /100 | #164 | Good 96.1% |
| Immigrants | Taiwan | 61.5 /100 | #165 | Good 96.1% |
| Immigrants | Kazakhstan | 61.0 /100 | #166 | Good 96.1% |
Demographics Similar to Immigrants from Iraq by 7th Grade
In terms of 7th grade, the demographic groups most similar to Immigrants from Iraq are Immigrants from Uganda (96.0%, a difference of 0.0%), Sierra Leonean (96.0%, a difference of 0.010%), Brazilian (96.0%, a difference of 0.010%), Immigrants from Egypt (95.9%, a difference of 0.010%), and Immigrants from Venezuela (95.9%, a difference of 0.010%).
| Demographics | Rating | Rank | 7th Grade |
| Immigrants | Iran | 47.8 /100 | #179 | Average 96.0% |
| Immigrants | Brazil | 46.8 /100 | #180 | Average 96.0% |
| Pakistanis | 44.5 /100 | #181 | Average 96.0% |
| Iraqis | 41.2 /100 | #182 | Average 96.0% |
| Immigrants | Spain | 38.8 /100 | #183 | Fair 96.0% |
| Sierra Leoneans | 37.5 /100 | #184 | Fair 96.0% |
| Brazilians | 37.3 /100 | #185 | Fair 96.0% |
| Immigrants | Iraq | 36.1 /100 | #186 | Fair 96.0% |
| Immigrants | Uganda | 36.0 /100 | #187 | Fair 96.0% |
| Immigrants | Egypt | 34.3 /100 | #188 | Fair 95.9% |
| Immigrants | Venezuela | 33.9 /100 | #189 | Fair 95.9% |
| Immigrants | Micronesia | 32.6 /100 | #190 | Fair 95.9% |
| Liberians | 32.5 /100 | #191 | Fair 95.9% |
| Panamanians | 32.3 /100 | #192 | Fair 95.9% |
| Immigrants | Bahamas | 30.8 /100 | #193 | Fair 95.9% |