Aleut vs Korean Median Earnings
COMPARE
Aleut
Korean
Median Earnings
Median Earnings Comparison
Aleuts
Koreans
$44,241
MEDIAN EARNINGS
4.4/ 100
METRIC RATING
240th/ 347
METRIC RANK
$48,727
MEDIAN EARNINGS
96.2/ 100
METRIC RATING
116th/ 347
METRIC RANK
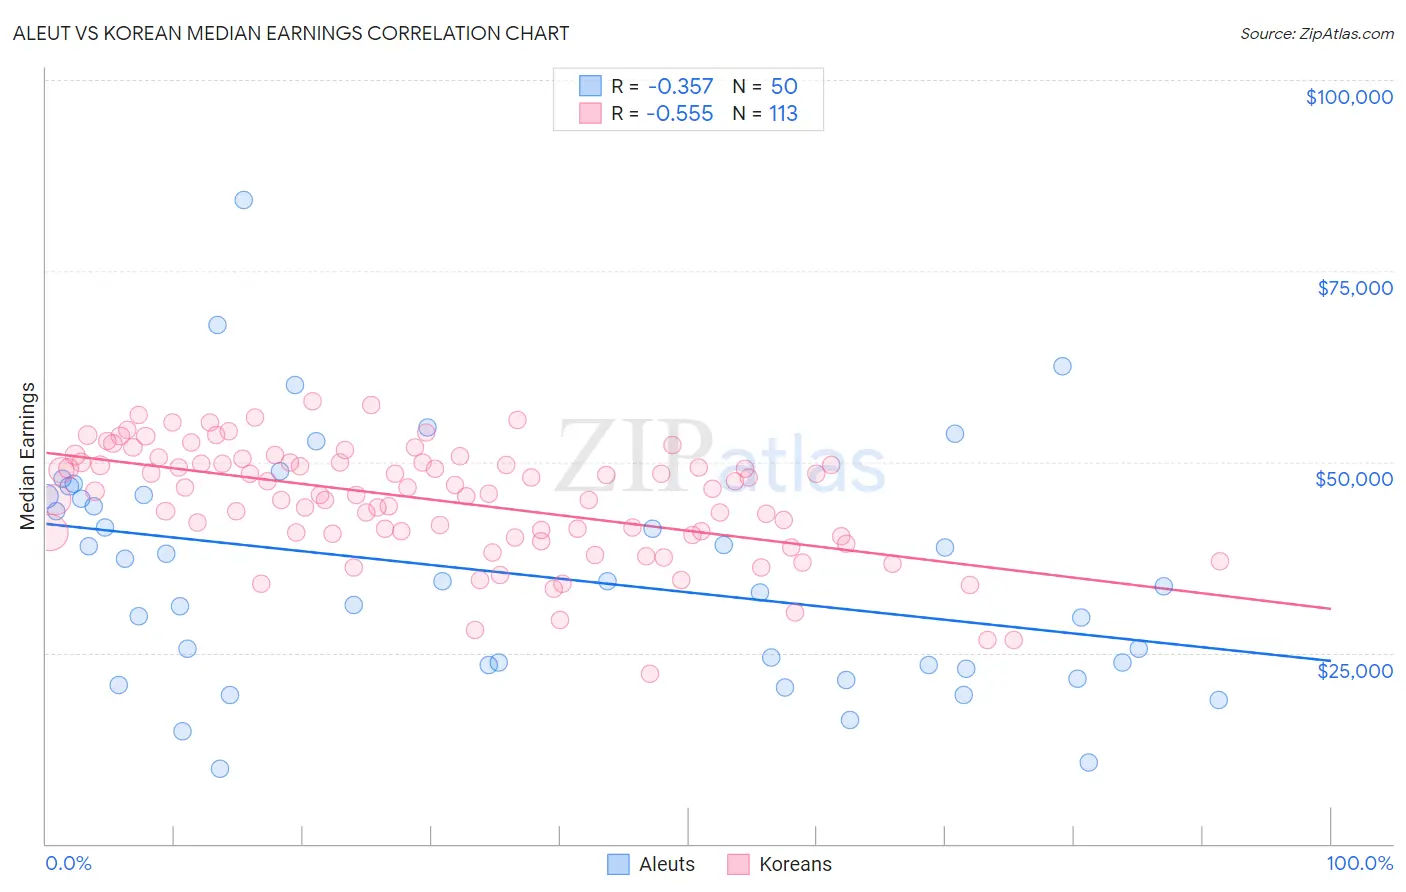
Aleut vs Korean Median Earnings Correlation Chart
The statistical analysis conducted on geographies consisting of 61,772,931 people shows a mild negative correlation between the proportion of Aleuts and median earnings in the United States with a correlation coefficient (R) of -0.357 and weighted average of $44,241. Similarly, the statistical analysis conducted on geographies consisting of 510,900,863 people shows a substantial negative correlation between the proportion of Koreans and median earnings in the United States with a correlation coefficient (R) of -0.555 and weighted average of $48,727, a difference of 10.1%.
Median Earnings Correlation Summary
| Measurement | Aleut | Korean |
| Minimum | $9,792 | $22,216 |
| Maximum | $84,286 | $57,875 |
| Range | $74,494 | $35,659 |
| Mean | $35,360 | $44,924 |
| Median | $34,021 | $46,110 |
| Interquartile 25% (IQ1) | $23,409 | $40,528 |
| Interquartile 75% (IQ3) | $45,452 | $49,935 |
| Interquartile Range (IQR) | $22,043 | $9,407 |
| Standard Deviation (Sample) | $15,491 | $7,353 |
| Standard Deviation (Population) | $15,336 | $7,320 |
Similar Demographics by Median Earnings
Demographics Similar to Aleuts by Median Earnings
In terms of median earnings, the demographic groups most similar to Aleuts are Samoan ($44,206, a difference of 0.080%), Immigrants from Venezuela ($44,163, a difference of 0.18%), Subsaharan African ($44,118, a difference of 0.28%), Nonimmigrants ($44,117, a difference of 0.28%), and Senegalese ($44,373, a difference of 0.30%).
| Demographics | Rating | Rank | Median Earnings |
| Immigrants | Sudan | 8.8 /100 | #233 | Tragic $44,767 |
| Cape Verdeans | 7.5 /100 | #234 | Tragic $44,640 |
| Venezuelans | 6.9 /100 | #235 | Tragic $44,580 |
| British West Indians | 6.7 /100 | #236 | Tragic $44,552 |
| Immigrants | Ecuador | 5.9 /100 | #237 | Tragic $44,462 |
| Sudanese | 5.6 /100 | #238 | Tragic $44,419 |
| Senegalese | 5.3 /100 | #239 | Tragic $44,373 |
| Aleuts | 4.4 /100 | #240 | Tragic $44,241 |
| Samoans | 4.2 /100 | #241 | Tragic $44,206 |
| Immigrants | Venezuela | 4.0 /100 | #242 | Tragic $44,163 |
| Sub-Saharan Africans | 3.7 /100 | #243 | Tragic $44,118 |
| Immigrants | Nonimmigrants | 3.7 /100 | #244 | Tragic $44,117 |
| Immigrants | Burma/Myanmar | 3.2 /100 | #245 | Tragic $43,998 |
| Immigrants | West Indies | 3.1 /100 | #246 | Tragic $43,989 |
| Immigrants | Cabo Verde | 3.0 /100 | #247 | Tragic $43,963 |
Demographics Similar to Koreans by Median Earnings
In terms of median earnings, the demographic groups most similar to Koreans are Serbian ($48,677, a difference of 0.10%), Immigrants from Jordan ($48,673, a difference of 0.11%), Polish ($48,659, a difference of 0.14%), Chinese ($48,836, a difference of 0.22%), and Moroccan ($48,838, a difference of 0.23%).
| Demographics | Rating | Rank | Median Earnings |
| Syrians | 97.1 /100 | #109 | Exceptional $48,934 |
| Immigrants | Ethiopia | 97.1 /100 | #110 | Exceptional $48,924 |
| Immigrants | Zimbabwe | 97.0 /100 | #111 | Exceptional $48,913 |
| Northern Europeans | 96.9 /100 | #112 | Exceptional $48,887 |
| Immigrants | Kuwait | 96.8 /100 | #113 | Exceptional $48,861 |
| Moroccans | 96.7 /100 | #114 | Exceptional $48,838 |
| Chinese | 96.7 /100 | #115 | Exceptional $48,836 |
| Koreans | 96.2 /100 | #116 | Exceptional $48,727 |
| Serbians | 95.9 /100 | #117 | Exceptional $48,677 |
| Immigrants | Jordan | 95.9 /100 | #118 | Exceptional $48,673 |
| Poles | 95.8 /100 | #119 | Exceptional $48,659 |
| Carpatho Rusyns | 95.5 /100 | #120 | Exceptional $48,617 |
| Arabs | 95.4 /100 | #121 | Exceptional $48,599 |
| Chileans | 94.8 /100 | #122 | Exceptional $48,504 |
| Immigrants | Syria | 93.9 /100 | #123 | Exceptional $48,375 |