Immigrants from Iran vs Immigrants from Switzerland Householder Income Under 25 years
COMPARE
Immigrants from Iran
Immigrants from Switzerland
Householder Income Under 25 years
Householder Income Under 25 years Comparison
Immigrants from Iran
Immigrants from Switzerland
$55,880
HOUSEHOLDER INCOME UNDER 25 YEARS
100.0/ 100
METRIC RATING
38th/ 347
METRIC RANK
$53,528
HOUSEHOLDER INCOME UNDER 25 YEARS
96.3/ 100
METRIC RATING
118th/ 347
METRIC RANK
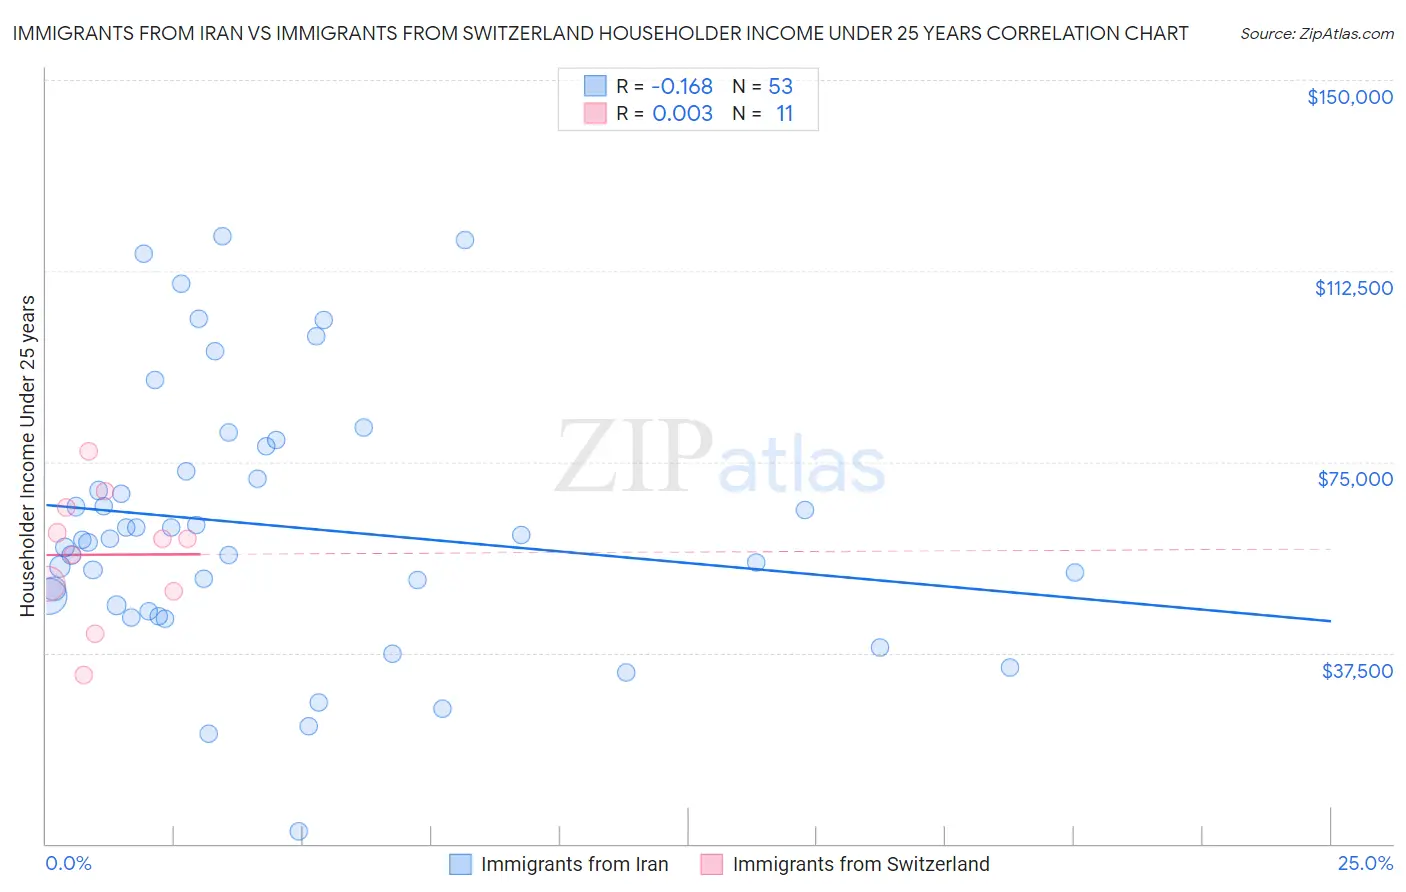
Immigrants from Iran vs Immigrants from Switzerland Householder Income Under 25 years Correlation Chart
The statistical analysis conducted on geographies consisting of 243,590,616 people shows a poor negative correlation between the proportion of Immigrants from Iran and household income with householder under the age of 25 in the United States with a correlation coefficient (R) of -0.168 and weighted average of $55,880. Similarly, the statistical analysis conducted on geographies consisting of 131,601,890 people shows no correlation between the proportion of Immigrants from Switzerland and household income with householder under the age of 25 in the United States with a correlation coefficient (R) of 0.003 and weighted average of $53,528, a difference of 4.4%.
Householder Income Under 25 years Correlation Summary
| Measurement | Immigrants from Iran | Immigrants from Switzerland |
| Minimum | $2,499 | $33,221 |
| Maximum | $119,306 | $77,010 |
| Range | $116,807 | $43,789 |
| Mean | $62,431 | $56,771 |
| Median | $59,731 | $59,792 |
| Interquartile 25% (IQ1) | $46,300 | $49,500 |
| Interquartile 75% (IQ3) | $75,617 | $66,059 |
| Interquartile Range (IQR) | $29,317 | $16,559 |
| Standard Deviation (Sample) | $25,668 | $12,523 |
| Standard Deviation (Population) | $25,425 | $11,940 |
Similar Demographics by Householder Income Under 25 years
Demographics Similar to Immigrants from Iran by Householder Income Under 25 years
In terms of householder income under 25 years, the demographic groups most similar to Immigrants from Iran are Immigrants from Russia ($55,891, a difference of 0.020%), Tlingit-Haida ($55,914, a difference of 0.060%), Immigrants from Israel ($55,913, a difference of 0.060%), Immigrants from Japan ($55,932, a difference of 0.090%), and Inupiat ($55,935, a difference of 0.10%).
| Demographics | Rating | Rank | Householder Income Under 25 years |
| Vietnamese | 100.0 /100 | #31 | Exceptional $56,127 |
| Peruvians | 100.0 /100 | #32 | Exceptional $56,052 |
| Inupiat | 100.0 /100 | #33 | Exceptional $55,935 |
| Immigrants | Japan | 100.0 /100 | #34 | Exceptional $55,932 |
| Tlingit-Haida | 100.0 /100 | #35 | Exceptional $55,914 |
| Immigrants | Israel | 100.0 /100 | #36 | Exceptional $55,913 |
| Immigrants | Russia | 100.0 /100 | #37 | Exceptional $55,891 |
| Immigrants | Iran | 100.0 /100 | #38 | Exceptional $55,880 |
| Immigrants | Belarus | 100.0 /100 | #39 | Exceptional $55,743 |
| Immigrants | Greece | 100.0 /100 | #40 | Exceptional $55,727 |
| Immigrants | Guyana | 100.0 /100 | #41 | Exceptional $55,726 |
| Immigrants | Korea | 100.0 /100 | #42 | Exceptional $55,716 |
| Immigrants | South Eastern Asia | 100.0 /100 | #43 | Exceptional $55,714 |
| Paraguayans | 100.0 /100 | #44 | Exceptional $55,614 |
| Spanish American Indians | 100.0 /100 | #45 | Exceptional $55,573 |
Demographics Similar to Immigrants from Switzerland by Householder Income Under 25 years
In terms of householder income under 25 years, the demographic groups most similar to Immigrants from Switzerland are Lithuanian ($53,552, a difference of 0.050%), Immigrants from Spain ($53,560, a difference of 0.060%), Immigrants from Albania ($53,597, a difference of 0.13%), Immigrants from Sweden ($53,621, a difference of 0.17%), and Italian ($53,426, a difference of 0.19%).
| Demographics | Rating | Rank | Householder Income Under 25 years |
| Immigrants | Colombia | 97.7 /100 | #111 | Exceptional $53,714 |
| Immigrants | Oceania | 97.5 /100 | #112 | Exceptional $53,680 |
| Romanians | 97.2 /100 | #113 | Exceptional $53,632 |
| Immigrants | Sweden | 97.1 /100 | #114 | Exceptional $53,621 |
| Immigrants | Albania | 96.9 /100 | #115 | Exceptional $53,597 |
| Immigrants | Spain | 96.6 /100 | #116 | Exceptional $53,560 |
| Lithuanians | 96.6 /100 | #117 | Exceptional $53,552 |
| Immigrants | Switzerland | 96.3 /100 | #118 | Exceptional $53,528 |
| Italians | 95.4 /100 | #119 | Exceptional $53,426 |
| Guamanians/Chamorros | 95.3 /100 | #120 | Exceptional $53,423 |
| Immigrants | Canada | 95.2 /100 | #121 | Exceptional $53,411 |
| Immigrants | Ethiopia | 95.2 /100 | #122 | Exceptional $53,408 |
| Immigrants | Iraq | 94.9 /100 | #123 | Exceptional $53,384 |
| Colombians | 94.6 /100 | #124 | Exceptional $53,357 |
| Pakistanis | 94.1 /100 | #125 | Exceptional $53,325 |