Immigrants from Lithuania vs Immigrants from Senegal Median Family Income
COMPARE
Immigrants from Lithuania
Immigrants from Senegal
Median Family Income
Median Family Income Comparison
Immigrants from Lithuania
Immigrants from Senegal
$118,053
MEDIAN FAMILY INCOME
100.0/ 100
METRIC RATING
40th/ 347
METRIC RANK
$92,912
MEDIAN FAMILY INCOME
0.7/ 100
METRIC RATING
247th/ 347
METRIC RANK
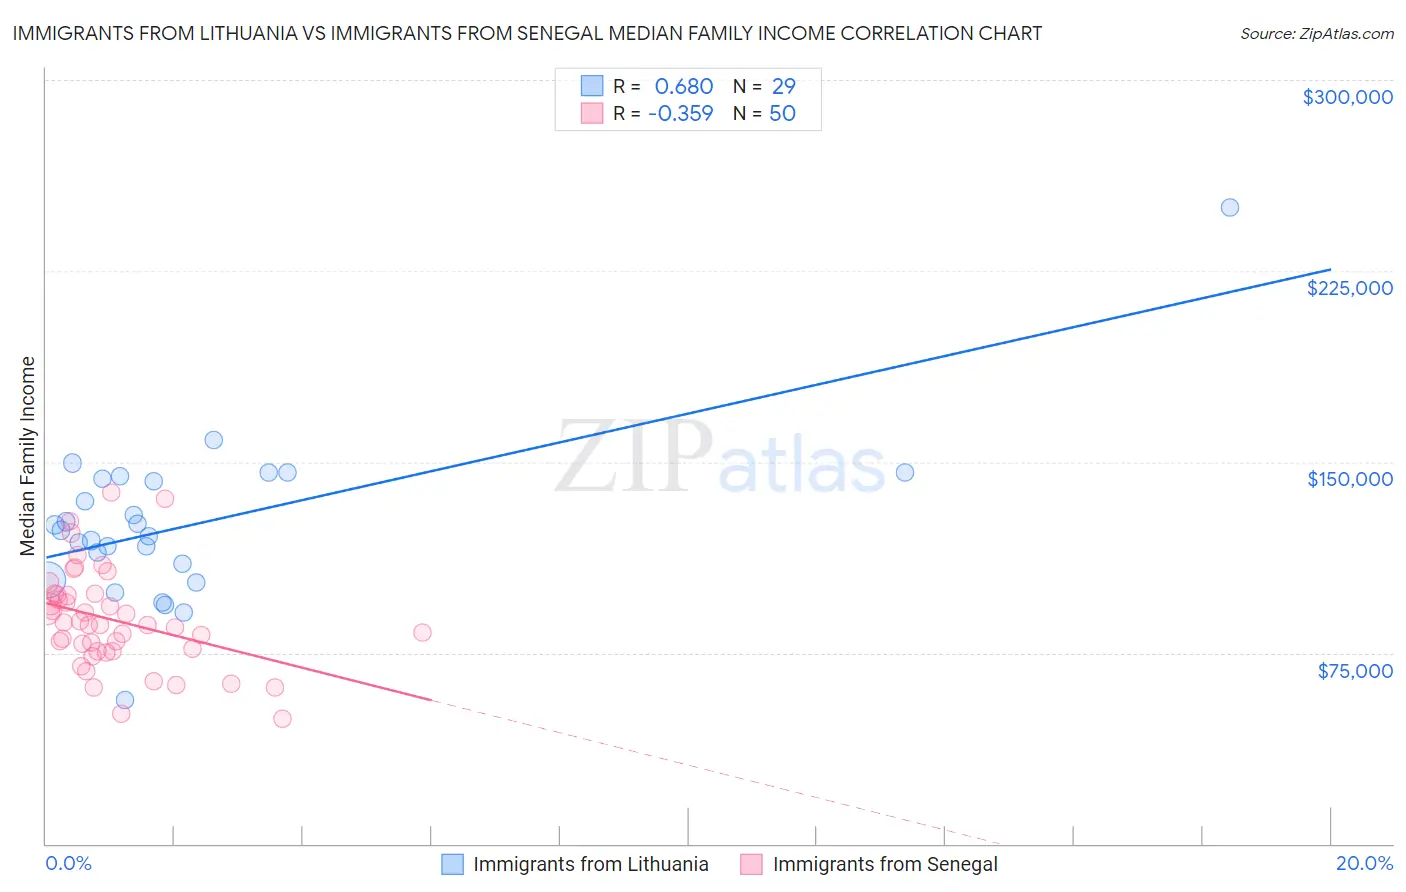
Immigrants from Lithuania vs Immigrants from Senegal Median Family Income Correlation Chart
The statistical analysis conducted on geographies consisting of 117,713,415 people shows a significant positive correlation between the proportion of Immigrants from Lithuania and median family income in the United States with a correlation coefficient (R) of 0.680 and weighted average of $118,053. Similarly, the statistical analysis conducted on geographies consisting of 90,105,018 people shows a mild negative correlation between the proportion of Immigrants from Senegal and median family income in the United States with a correlation coefficient (R) of -0.359 and weighted average of $92,912, a difference of 27.1%.
Median Family Income Correlation Summary
| Measurement | Immigrants from Lithuania | Immigrants from Senegal |
| Minimum | $56,363 | $49,167 |
| Maximum | $250,001 | $137,892 |
| Range | $193,638 | $88,725 |
| Mean | $125,785 | $87,849 |
| Median | $123,201 | $85,966 |
| Interquartile 25% (IQ1) | $106,762 | $75,730 |
| Interquartile 75% (IQ3) | $143,837 | $97,800 |
| Interquartile Range (IQR) | $37,076 | $22,070 |
| Standard Deviation (Sample) | $32,594 | $19,522 |
| Standard Deviation (Population) | $32,027 | $19,326 |
Similar Demographics by Median Family Income
Demographics Similar to Immigrants from Lithuania by Median Family Income
In terms of median family income, the demographic groups most similar to Immigrants from Lithuania are Estonian ($118,013, a difference of 0.030%), Immigrants from Bolivia ($117,912, a difference of 0.12%), Immigrants from Asia ($118,291, a difference of 0.20%), Bulgarian ($117,818, a difference of 0.20%), and Immigrants from Turkey ($118,325, a difference of 0.23%).
| Demographics | Rating | Rank | Median Family Income |
| Bhutanese | 100.0 /100 | #33 | Exceptional $119,800 |
| Bolivians | 100.0 /100 | #34 | Exceptional $119,479 |
| Soviet Union | 100.0 /100 | #35 | Exceptional $119,262 |
| Israelis | 100.0 /100 | #36 | Exceptional $118,577 |
| Australians | 100.0 /100 | #37 | Exceptional $118,440 |
| Immigrants | Turkey | 100.0 /100 | #38 | Exceptional $118,325 |
| Immigrants | Asia | 100.0 /100 | #39 | Exceptional $118,291 |
| Immigrants | Lithuania | 100.0 /100 | #40 | Exceptional $118,053 |
| Estonians | 100.0 /100 | #41 | Exceptional $118,013 |
| Immigrants | Bolivia | 100.0 /100 | #42 | Exceptional $117,912 |
| Bulgarians | 100.0 /100 | #43 | Exceptional $117,818 |
| Cambodians | 100.0 /100 | #44 | Exceptional $117,780 |
| Immigrants | Greece | 99.9 /100 | #45 | Exceptional $117,344 |
| Immigrants | Russia | 99.9 /100 | #46 | Exceptional $116,942 |
| Immigrants | Austria | 99.9 /100 | #47 | Exceptional $116,830 |
Demographics Similar to Immigrants from Senegal by Median Family Income
In terms of median family income, the demographic groups most similar to Immigrants from Senegal are French American Indian ($92,872, a difference of 0.040%), Immigrants from Ecuador ($92,837, a difference of 0.080%), West Indian ($92,765, a difference of 0.16%), Immigrants from Somalia ($92,609, a difference of 0.33%), and Immigrants from El Salvador ($92,545, a difference of 0.40%).
| Demographics | Rating | Rank | Median Family Income |
| Somalis | 1.2 /100 | #240 | Tragic $94,085 |
| Immigrants | Trinidad and Tobago | 1.2 /100 | #241 | Tragic $93,988 |
| Barbadians | 1.1 /100 | #242 | Tragic $93,919 |
| German Russians | 1.1 /100 | #243 | Tragic $93,858 |
| Sub-Saharan Africans | 1.0 /100 | #244 | Tragic $93,748 |
| Immigrants | Middle Africa | 1.0 /100 | #245 | Tragic $93,593 |
| Guyanese | 0.9 /100 | #246 | Tragic $93,373 |
| Immigrants | Senegal | 0.7 /100 | #247 | Tragic $92,912 |
| French American Indians | 0.7 /100 | #248 | Tragic $92,872 |
| Immigrants | Ecuador | 0.7 /100 | #249 | Tragic $92,837 |
| West Indians | 0.6 /100 | #250 | Tragic $92,765 |
| Immigrants | Somalia | 0.6 /100 | #251 | Tragic $92,609 |
| Immigrants | El Salvador | 0.6 /100 | #252 | Tragic $92,545 |
| Immigrants | Guyana | 0.6 /100 | #253 | Tragic $92,513 |
| Immigrants | Barbados | 0.5 /100 | #254 | Tragic $92,419 |