Alaska Native vs Immigrants from South Central Asia Median Family Income
COMPARE
Alaska Native
Immigrants from South Central Asia
Median Family Income
Median Family Income Comparison
Alaska Natives
Immigrants from South Central Asia
$95,573
MEDIAN FAMILY INCOME
2.6/ 100
METRIC RATING
227th/ 347
METRIC RANK
$125,956
MEDIAN FAMILY INCOME
100.0/ 100
METRIC RATING
14th/ 347
METRIC RANK
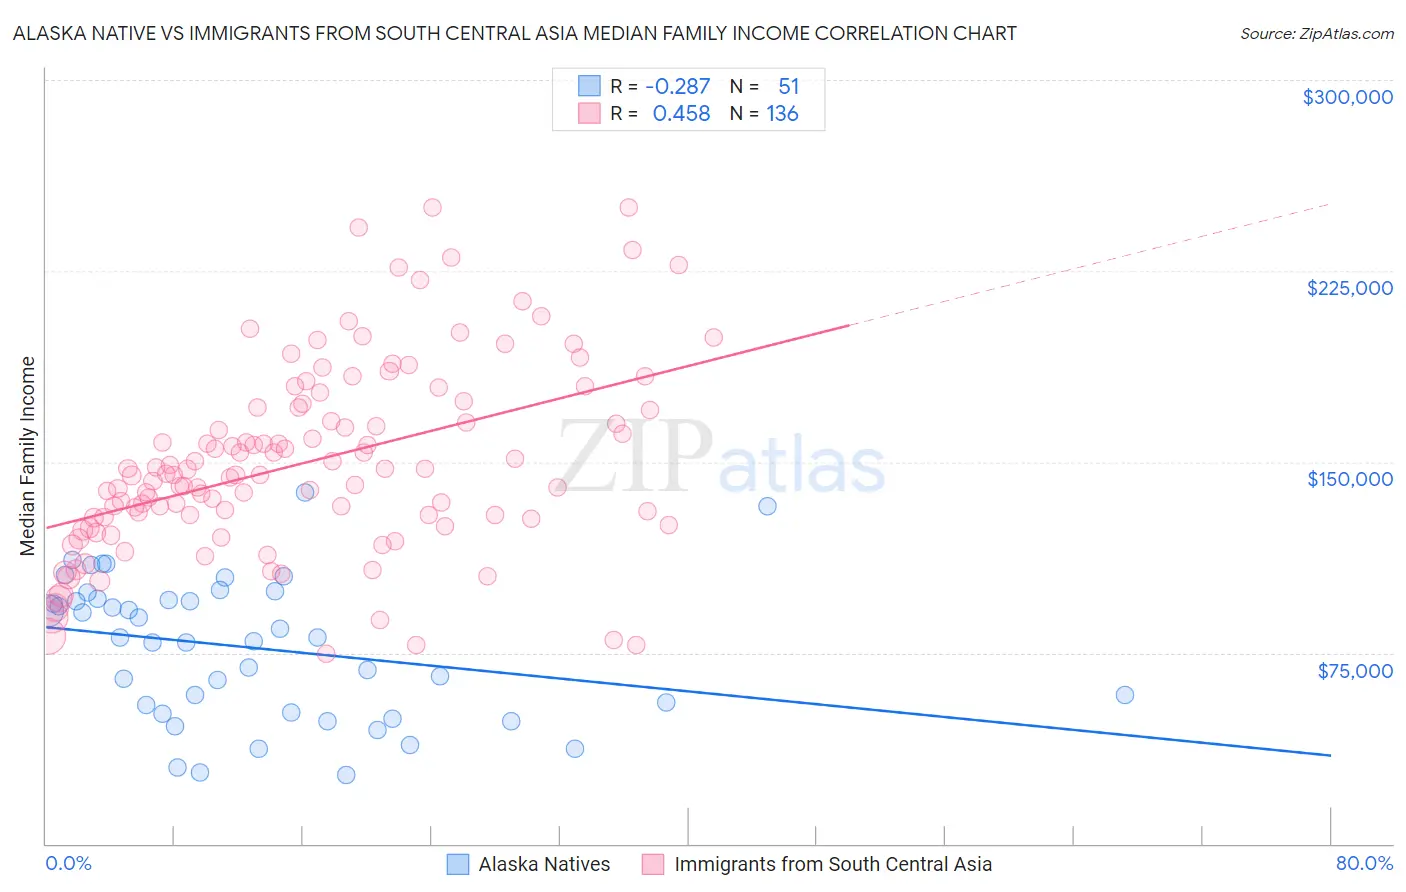
Alaska Native vs Immigrants from South Central Asia Median Family Income Correlation Chart
The statistical analysis conducted on geographies consisting of 76,737,851 people shows a weak negative correlation between the proportion of Alaska Natives and median family income in the United States with a correlation coefficient (R) of -0.287 and weighted average of $95,573. Similarly, the statistical analysis conducted on geographies consisting of 472,438,765 people shows a moderate positive correlation between the proportion of Immigrants from South Central Asia and median family income in the United States with a correlation coefficient (R) of 0.458 and weighted average of $125,956, a difference of 31.8%.
Median Family Income Correlation Summary
| Measurement | Alaska Native | Immigrants from South Central Asia |
| Minimum | $27,083 | $74,415 |
| Maximum | $137,917 | $250,001 |
| Range | $110,834 | $175,586 |
| Mean | $77,054 | $149,714 |
| Median | $80,833 | $145,025 |
| Interquartile 25% (IQ1) | $51,316 | $127,772 |
| Interquartile 75% (IQ3) | $96,369 | $171,402 |
| Interquartile Range (IQR) | $45,053 | $43,630 |
| Standard Deviation (Sample) | $27,527 | $37,158 |
| Standard Deviation (Population) | $27,256 | $37,021 |
Similar Demographics by Median Family Income
Demographics Similar to Alaska Natives by Median Family Income
In terms of median family income, the demographic groups most similar to Alaska Natives are Immigrants from Panama ($95,647, a difference of 0.080%), Immigrants from the Azores ($95,402, a difference of 0.18%), Marshallese ($95,293, a difference of 0.29%), Malaysian ($95,230, a difference of 0.36%), and Ecuadorian ($95,114, a difference of 0.48%).
| Demographics | Rating | Rank | Median Family Income |
| Sudanese | 4.7 /100 | #220 | Tragic $96,783 |
| Immigrants | Ghana | 4.2 /100 | #221 | Tragic $96,544 |
| Immigrants | Nigeria | 4.0 /100 | #222 | Tragic $96,439 |
| Venezuelans | 3.7 /100 | #223 | Tragic $96,281 |
| Immigrants | Nonimmigrants | 3.6 /100 | #224 | Tragic $96,231 |
| Vietnamese | 3.4 /100 | #225 | Tragic $96,123 |
| Immigrants | Panama | 2.7 /100 | #226 | Tragic $95,647 |
| Alaska Natives | 2.6 /100 | #227 | Tragic $95,573 |
| Immigrants | Azores | 2.4 /100 | #228 | Tragic $95,402 |
| Marshallese | 2.2 /100 | #229 | Tragic $95,293 |
| Malaysians | 2.2 /100 | #230 | Tragic $95,230 |
| Ecuadorians | 2.1 /100 | #231 | Tragic $95,114 |
| Immigrants | Venezuela | 1.9 /100 | #232 | Tragic $94,904 |
| Immigrants | Bangladesh | 1.6 /100 | #233 | Tragic $94,665 |
| Immigrants | Western Africa | 1.6 /100 | #234 | Tragic $94,638 |
Demographics Similar to Immigrants from South Central Asia by Median Family Income
In terms of median family income, the demographic groups most similar to Immigrants from South Central Asia are Eastern European ($125,546, a difference of 0.33%), Immigrants from China ($125,540, a difference of 0.33%), Indian (Asian) ($125,312, a difference of 0.51%), Immigrants from Australia ($126,620, a difference of 0.53%), and Immigrants from Eastern Asia ($125,150, a difference of 0.64%).
| Demographics | Rating | Rank | Median Family Income |
| Immigrants | Hong Kong | 100.0 /100 | #7 | Exceptional $131,067 |
| Immigrants | Iran | 100.0 /100 | #8 | Exceptional $130,894 |
| Okinawans | 100.0 /100 | #9 | Exceptional $129,979 |
| Immigrants | Ireland | 100.0 /100 | #10 | Exceptional $127,584 |
| Immigrants | Israel | 100.0 /100 | #11 | Exceptional $127,430 |
| Cypriots | 100.0 /100 | #12 | Exceptional $127,064 |
| Immigrants | Australia | 100.0 /100 | #13 | Exceptional $126,620 |
| Immigrants | South Central Asia | 100.0 /100 | #14 | Exceptional $125,956 |
| Eastern Europeans | 100.0 /100 | #15 | Exceptional $125,546 |
| Immigrants | China | 100.0 /100 | #16 | Exceptional $125,540 |
| Indians (Asian) | 100.0 /100 | #17 | Exceptional $125,312 |
| Immigrants | Eastern Asia | 100.0 /100 | #18 | Exceptional $125,150 |
| Immigrants | Belgium | 100.0 /100 | #19 | Exceptional $123,831 |
| Burmese | 100.0 /100 | #20 | Exceptional $123,369 |
| Immigrants | Korea | 100.0 /100 | #21 | Exceptional $122,800 |