Immigrants from South Central Asia vs Somali Median Male Earnings
COMPARE
Immigrants from South Central Asia
Somali
Median Male Earnings
Median Male Earnings Comparison
Immigrants from South Central Asia
Somalis
$68,960
MEDIAN MALE EARNINGS
100.0/ 100
METRIC RATING
9th/ 347
METRIC RANK
$49,025
MEDIAN MALE EARNINGS
0.5/ 100
METRIC RATING
266th/ 347
METRIC RANK
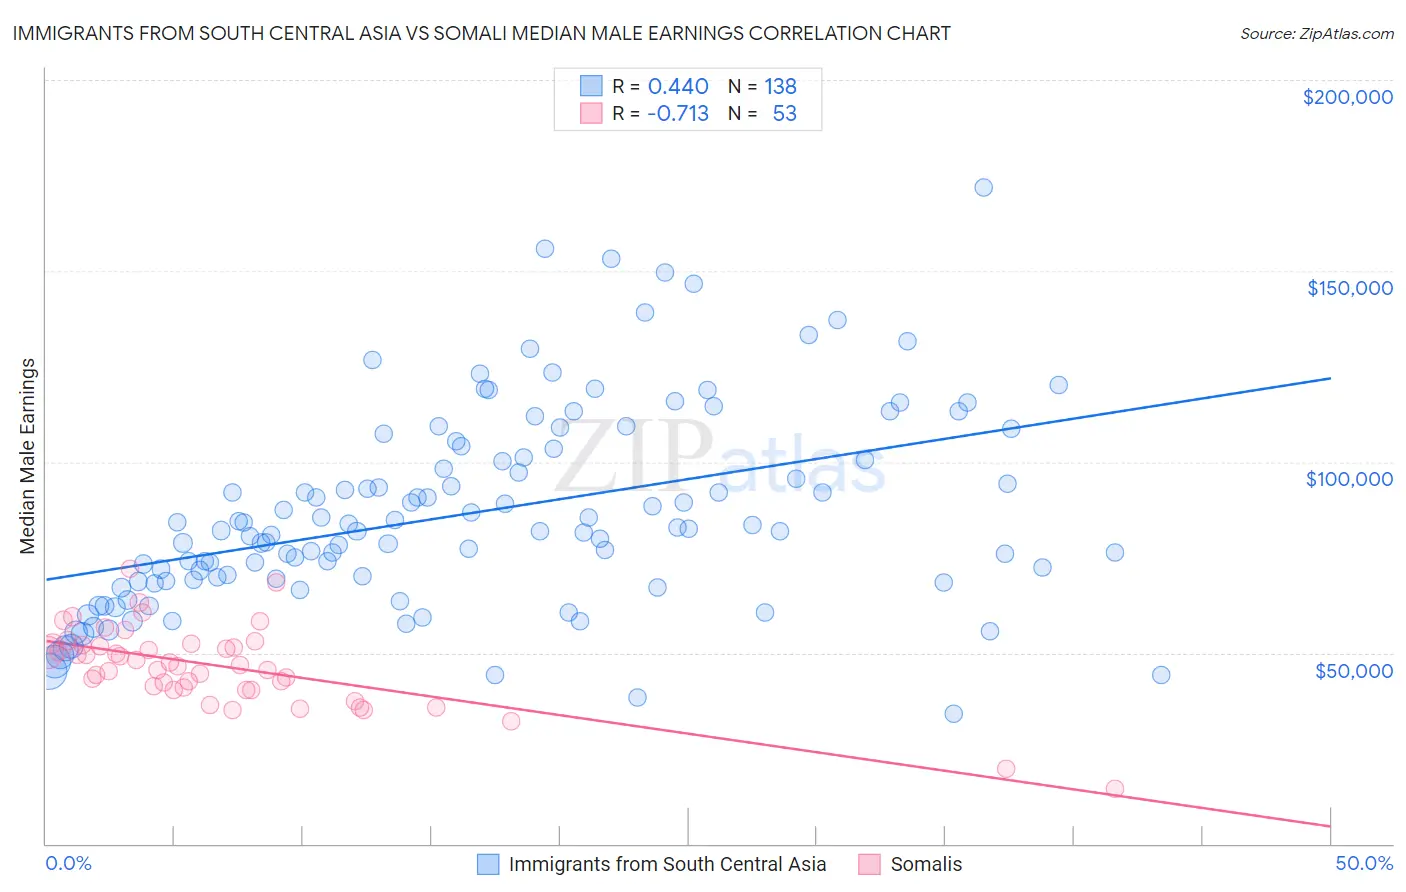
Immigrants from South Central Asia vs Somali Median Male Earnings Correlation Chart
The statistical analysis conducted on geographies consisting of 472,946,789 people shows a moderate positive correlation between the proportion of Immigrants from South Central Asia and median male earnings in the United States with a correlation coefficient (R) of 0.440 and weighted average of $68,960. Similarly, the statistical analysis conducted on geographies consisting of 99,323,068 people shows a strong negative correlation between the proportion of Somalis and median male earnings in the United States with a correlation coefficient (R) of -0.713 and weighted average of $49,025, a difference of 40.7%.
Median Male Earnings Correlation Summary
| Measurement | Immigrants from South Central Asia | Somali |
| Minimum | $34,167 | $14,382 |
| Maximum | $171,875 | $71,947 |
| Range | $137,708 | $57,565 |
| Mean | $86,430 | $46,539 |
| Median | $81,870 | $46,803 |
| Interquartile 25% (IQ1) | $68,829 | $40,598 |
| Interquartile 75% (IQ3) | $101,052 | $52,221 |
| Interquartile Range (IQR) | $32,223 | $11,623 |
| Standard Deviation (Sample) | $26,034 | $10,412 |
| Standard Deviation (Population) | $25,940 | $10,313 |
Similar Demographics by Median Male Earnings
Demographics Similar to Immigrants from South Central Asia by Median Male Earnings
In terms of median male earnings, the demographic groups most similar to Immigrants from South Central Asia are Immigrants from Israel ($68,716, a difference of 0.35%), Immigrants from Iran ($69,284, a difference of 0.47%), Immigrants from Hong Kong ($70,146, a difference of 1.7%), Immigrants from Ireland ($67,698, a difference of 1.9%), and Immigrants from Australia ($67,634, a difference of 2.0%).
| Demographics | Rating | Rank | Median Male Earnings |
| Immigrants | India | 100.0 /100 | #2 | Exceptional $74,207 |
| Immigrants | Taiwan | 100.0 /100 | #3 | Exceptional $74,031 |
| Thais | 100.0 /100 | #4 | Exceptional $72,135 |
| Immigrants | Singapore | 100.0 /100 | #5 | Exceptional $71,348 |
| Iranians | 100.0 /100 | #6 | Exceptional $70,648 |
| Immigrants | Hong Kong | 100.0 /100 | #7 | Exceptional $70,146 |
| Immigrants | Iran | 100.0 /100 | #8 | Exceptional $69,284 |
| Immigrants | South Central Asia | 100.0 /100 | #9 | Exceptional $68,960 |
| Immigrants | Israel | 100.0 /100 | #10 | Exceptional $68,716 |
| Immigrants | Ireland | 100.0 /100 | #11 | Exceptional $67,698 |
| Immigrants | Australia | 100.0 /100 | #12 | Exceptional $67,634 |
| Immigrants | China | 100.0 /100 | #13 | Exceptional $67,353 |
| Okinawans | 100.0 /100 | #14 | Exceptional $67,232 |
| Immigrants | Eastern Asia | 100.0 /100 | #15 | Exceptional $66,903 |
| Eastern Europeans | 100.0 /100 | #16 | Exceptional $66,472 |
Demographics Similar to Somalis by Median Male Earnings
In terms of median male earnings, the demographic groups most similar to Somalis are Spanish American ($49,008, a difference of 0.040%), Ute ($48,899, a difference of 0.26%), Immigrants from Laos ($49,190, a difference of 0.34%), Immigrants from Middle Africa ($49,201, a difference of 0.36%), and Nicaraguan ($49,215, a difference of 0.39%).
| Demographics | Rating | Rank | Median Male Earnings |
| Nepalese | 0.7 /100 | #259 | Tragic $49,458 |
| Iroquois | 0.7 /100 | #260 | Tragic $49,374 |
| Liberians | 0.6 /100 | #261 | Tragic $49,318 |
| Immigrants | West Indies | 0.6 /100 | #262 | Tragic $49,271 |
| Nicaraguans | 0.6 /100 | #263 | Tragic $49,215 |
| Immigrants | Middle Africa | 0.6 /100 | #264 | Tragic $49,201 |
| Immigrants | Laos | 0.6 /100 | #265 | Tragic $49,190 |
| Somalis | 0.5 /100 | #266 | Tragic $49,025 |
| Spanish Americans | 0.5 /100 | #267 | Tragic $49,008 |
| Ute | 0.4 /100 | #268 | Tragic $48,899 |
| Tsimshian | 0.4 /100 | #269 | Tragic $48,836 |
| Potawatomi | 0.4 /100 | #270 | Tragic $48,768 |
| Cherokee | 0.3 /100 | #271 | Tragic $48,669 |
| Salvadorans | 0.3 /100 | #272 | Tragic $48,646 |
| Jamaicans | 0.3 /100 | #273 | Tragic $48,632 |