Immigrants from Bulgaria vs Somali Median Male Earnings
COMPARE
Immigrants from Bulgaria
Somali
Median Male Earnings
Median Male Earnings Comparison
Immigrants from Bulgaria
Somalis
$60,358
MEDIAN MALE EARNINGS
99.7/ 100
METRIC RATING
70th/ 347
METRIC RANK
$49,025
MEDIAN MALE EARNINGS
0.5/ 100
METRIC RATING
266th/ 347
METRIC RANK
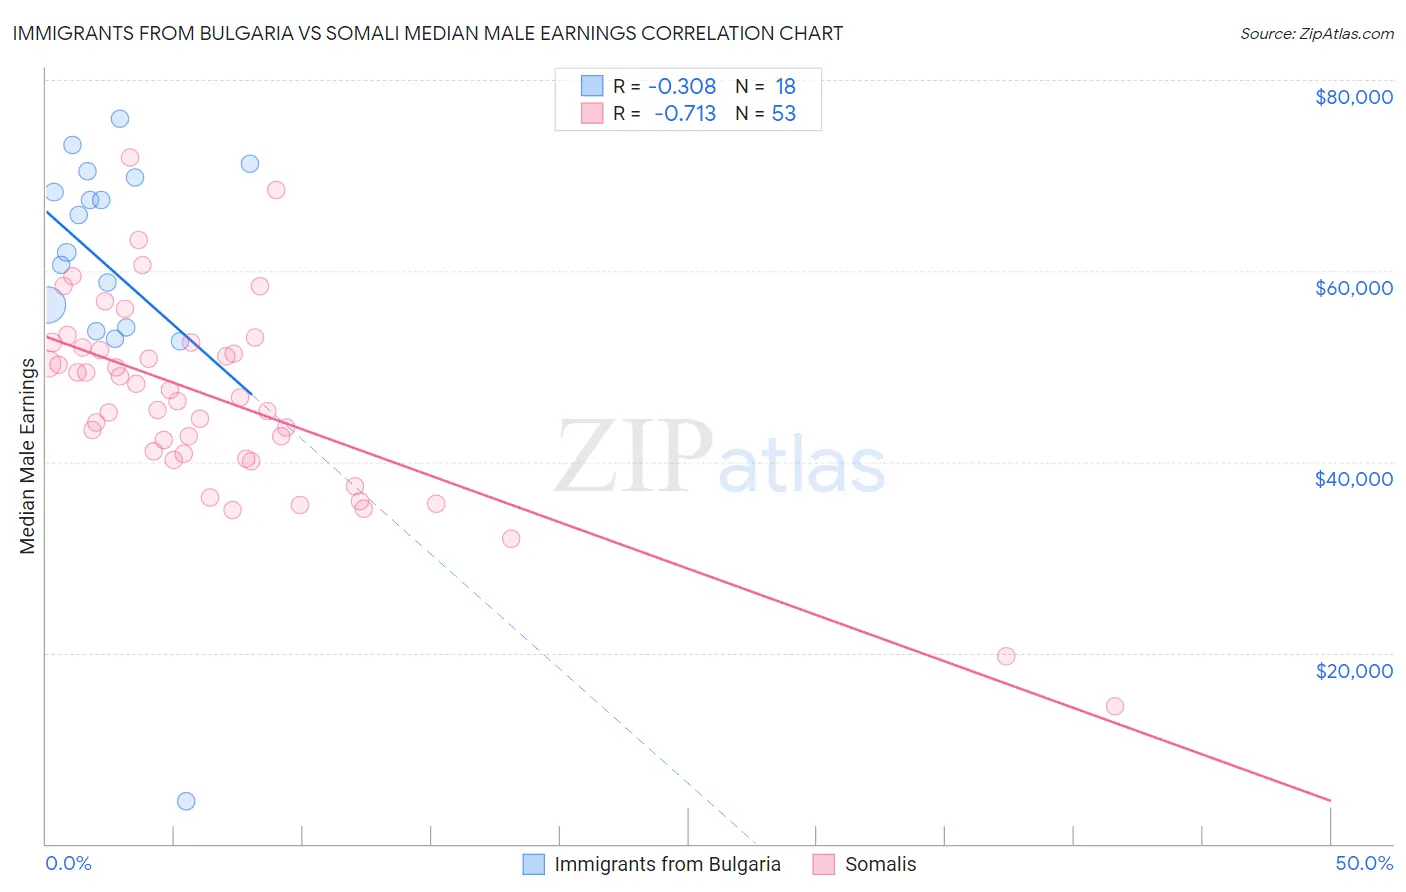
Immigrants from Bulgaria vs Somali Median Male Earnings Correlation Chart
The statistical analysis conducted on geographies consisting of 172,534,572 people shows a mild negative correlation between the proportion of Immigrants from Bulgaria and median male earnings in the United States with a correlation coefficient (R) of -0.308 and weighted average of $60,358. Similarly, the statistical analysis conducted on geographies consisting of 99,323,068 people shows a strong negative correlation between the proportion of Somalis and median male earnings in the United States with a correlation coefficient (R) of -0.713 and weighted average of $49,025, a difference of 23.1%.
Median Male Earnings Correlation Summary
| Measurement | Immigrants from Bulgaria | Somali |
| Minimum | $4,447 | $14,382 |
| Maximum | $75,897 | $71,947 |
| Range | $71,450 | $57,565 |
| Mean | $60,294 | $46,539 |
| Median | $63,912 | $46,803 |
| Interquartile 25% (IQ1) | $54,049 | $40,598 |
| Interquartile 75% (IQ3) | $69,736 | $52,221 |
| Interquartile Range (IQR) | $15,687 | $11,623 |
| Standard Deviation (Sample) | $15,823 | $10,412 |
| Standard Deviation (Population) | $15,377 | $10,313 |
Similar Demographics by Median Male Earnings
Demographics Similar to Immigrants from Bulgaria by Median Male Earnings
In terms of median male earnings, the demographic groups most similar to Immigrants from Bulgaria are Mongolian ($60,350, a difference of 0.010%), Immigrants from Western Europe ($60,334, a difference of 0.040%), Immigrants from Canada ($60,388, a difference of 0.050%), Immigrants from North America ($60,265, a difference of 0.16%), and Immigrants from Serbia ($60,600, a difference of 0.40%).
| Demographics | Rating | Rank | Median Male Earnings |
| Immigrants | Pakistan | 99.8 /100 | #63 | Exceptional $60,987 |
| Immigrants | Eastern Europe | 99.8 /100 | #64 | Exceptional $60,958 |
| Immigrants | Indonesia | 99.8 /100 | #65 | Exceptional $60,935 |
| Immigrants | Croatia | 99.8 /100 | #66 | Exceptional $60,914 |
| Immigrants | Spain | 99.8 /100 | #67 | Exceptional $60,750 |
| Immigrants | Serbia | 99.7 /100 | #68 | Exceptional $60,600 |
| Immigrants | Canada | 99.7 /100 | #69 | Exceptional $60,388 |
| Immigrants | Bulgaria | 99.7 /100 | #70 | Exceptional $60,358 |
| Mongolians | 99.7 /100 | #71 | Exceptional $60,350 |
| Immigrants | Western Europe | 99.7 /100 | #72 | Exceptional $60,334 |
| Immigrants | North America | 99.7 /100 | #73 | Exceptional $60,265 |
| Argentineans | 99.6 /100 | #74 | Exceptional $60,117 |
| Immigrants | Bolivia | 99.6 /100 | #75 | Exceptional $60,088 |
| Romanians | 99.6 /100 | #76 | Exceptional $60,063 |
| Paraguayans | 99.5 /100 | #77 | Exceptional $59,975 |
Demographics Similar to Somalis by Median Male Earnings
In terms of median male earnings, the demographic groups most similar to Somalis are Spanish American ($49,008, a difference of 0.040%), Ute ($48,899, a difference of 0.26%), Immigrants from Laos ($49,190, a difference of 0.34%), Immigrants from Middle Africa ($49,201, a difference of 0.36%), and Nicaraguan ($49,215, a difference of 0.39%).
| Demographics | Rating | Rank | Median Male Earnings |
| Nepalese | 0.7 /100 | #259 | Tragic $49,458 |
| Iroquois | 0.7 /100 | #260 | Tragic $49,374 |
| Liberians | 0.6 /100 | #261 | Tragic $49,318 |
| Immigrants | West Indies | 0.6 /100 | #262 | Tragic $49,271 |
| Nicaraguans | 0.6 /100 | #263 | Tragic $49,215 |
| Immigrants | Middle Africa | 0.6 /100 | #264 | Tragic $49,201 |
| Immigrants | Laos | 0.6 /100 | #265 | Tragic $49,190 |
| Somalis | 0.5 /100 | #266 | Tragic $49,025 |
| Spanish Americans | 0.5 /100 | #267 | Tragic $49,008 |
| Ute | 0.4 /100 | #268 | Tragic $48,899 |
| Tsimshian | 0.4 /100 | #269 | Tragic $48,836 |
| Potawatomi | 0.4 /100 | #270 | Tragic $48,768 |
| Cherokee | 0.3 /100 | #271 | Tragic $48,669 |
| Salvadorans | 0.3 /100 | #272 | Tragic $48,646 |
| Jamaicans | 0.3 /100 | #273 | Tragic $48,632 |